![]() Figure 2 of
Honda, Mol Vis 2001;
7:63-70.
Figure 2 of
Honda, Mol Vis 2001;
7:63-70.
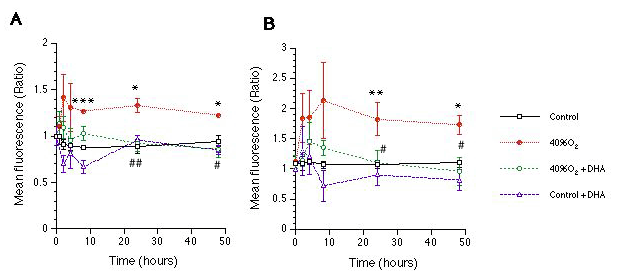
Figure 2. Measurement of intracellular ROI production
Flow cytometric measurement of ROI production in RPE340 cells (A) and WI38 cells (B) over time. Cells were preincubated at each time point in 20% O2 (Control) and 40% O2 with or without 150 mM DHA before adding H2DCFDA. Values are shown as mean±SE of three independent experiments. Data of each condition were compared at the same time point. Significance levels for comparison to controls: *p<0.05, **p<0.01. Significance levels for comparison to hyperoxia treated cells without DHA: #p<0.05, ##p<0.01.
