![]() Figure 1 of
Honda, Mol Vis 2001;
7:63-70.
Figure 1 of
Honda, Mol Vis 2001;
7:63-70.
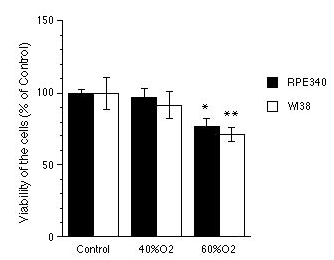
Figure 1. Viability of cells after hyperoxic treatment
Viability of RPE340 and WI38 cells under 20% O2 (Control), 40% O2 and 60% O2. Values are shown as mean±SE from three independent experiments, and the value of control is regarded as 100% in each cell line. Significance levels: *p<0.05, **p<0.01.
