![]() Figure 8 of
Gross, Mol Vis 2000;
6:51-62.
Figure 8 of
Gross, Mol Vis 2000;
6:51-62.
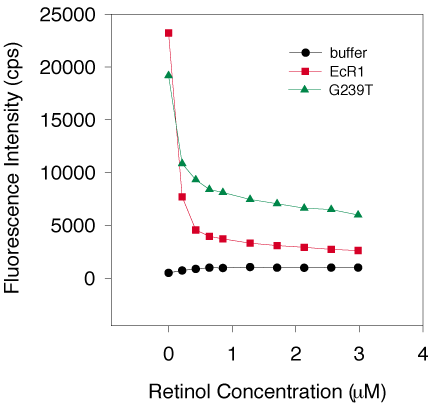
Figure 8. Fluorescence quenching by all-trans-retinol
Three separate G239T preparations (0.7 mM of each protein, average indicated by green triangles) and two individual EcR1 protein preparations (also 0.7 mM, average represented by red squares) were titrated with all-trans-retinol and the quenching of intrinsic protein fluorescence was measured by excitation at 280 nm and emission at 336 nm. Background fluorescence was examined by adding ligand to buffer without protein and is represented by the black circles. Protein fluorescence dropped sharply between 0 and 0.5 mM retinol concentration with all protein preparations, suggesting a high affinity interaction. Defining nonsaturable fluorescence intensity as signal below a line drawn through the last four points of the curves (retinol concentrations of about 2 to 3 mM), the amount of intrinsic protein fluorescence that was quenched was 83% for EcR1 and 58% for G239T. Both proteins demonstrated specific retinol binding compared to the buffer control (as indicated by the low concentrations of ligand needed for the rapid decrease in fluorescence and apparent saturation by 2 mM ligand concentration). Retinol quenched intrinsic protein fluorescence of EcR1 more than G239T. The difference in quenching (58 versus 83%) was attributed to either (1) a lesser amount of retinol that could be bound by G239T, (2) ligand binding to different sites in the proteins, or (3) a different spatial arrangement of tryptophans in the two proteins. The latter explanation seemed unlikely given the sequence identity between EcR1 and G239T (except at position 239) and the similar CD spectra.
