![]() Figure 3 of
Gross, Mol Vis 2000;
6:51-62.
Figure 3 of
Gross, Mol Vis 2000;
6:51-62.
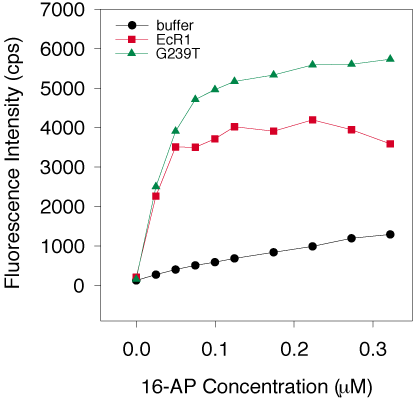
Figure 3. 16-AP fluorescence enhancement
Aliquots of 16-AP were added into independent preparations of 1.0 mM G239T (average from three independent preparations, represented by the green triangles), 1.0 mM wild type EcR1 (red squares), or buffer without protein (black circles). Fluorescence enhancement of 16-AP was measured by excitation at 363 nm and emission at 432 nm. In this and all other equilibrium binding experiments, the buffer was 300 mM NaCl, 50 mM NaPO4, pH 7.0, which afforded the best stability for G239T. In this and other binding experiments (Figures 3 and 6-12), the abscissa represents the accumulated total concentration of the ligand added to the cuvette; the ordinate represents fluorescence intensity measured with a photon counting spectrofluorometer in photons counted per second (cps). 0.5 or 1 ml aliquots of the ligand (dissolved in ethanol) were added to 700 ml volume of protein solution in the cuvette, making 10-15 additions of the ligand. The final ethanol concentration did not exceed 2.5% (v/v).
