![]() Figure 2 of
Gross, Mol Vis 2000;
6:51-62.
Figure 2 of
Gross, Mol Vis 2000;
6:51-62.
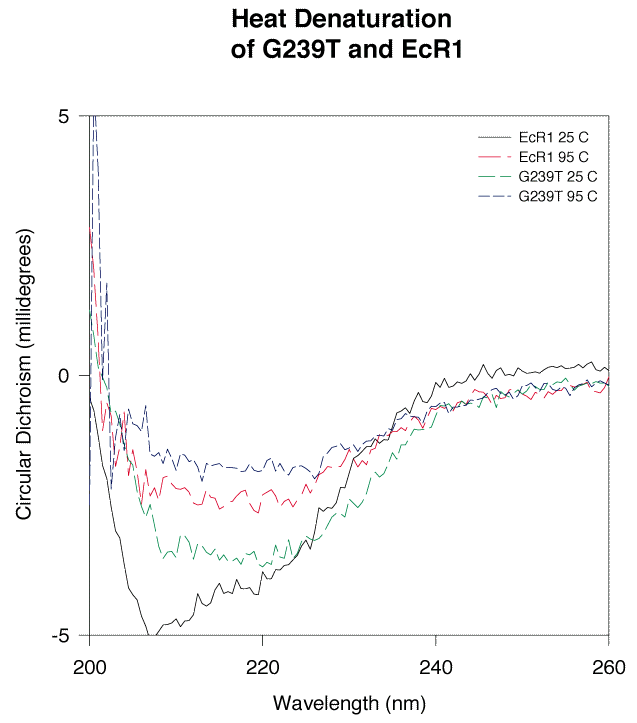
Figure 2. Circular dichroism measurements of EcR1 and G239T
Experiments were carried out in 300 mM NaCl, 50 mM NaPO4, pH 7. CD spectroscopy employed a Jasco J-715 spectropolarimeter (Easton, MD), and an RTE-111 temperature controller (Neslab, Portsmouth, NH). Spectra were collected in 0.5 mm path length cells from 200 to 260 nm. 3 mM samples were used, heated at about 1°C per min, and spectra were obtained at 25°C and 95°C. To assure temperature equilibrium was reached, samples were incubated for 2 min at each scanning temperature before the spectrum was recorded. The profiles of the two spectra showed minima at about 208 nm and a broad shoulder up to about 225 nm on both EcR1 and G239T. While the spectra were not identical in shape, they appeared similar, suggesting a grossly similar three dimensional shape. After high temperature treatment the CD spectra were very similar.
