![]() Figure 12 of
Gross, Mol Vis 2000;
6:51-62.
Figure 12 of
Gross, Mol Vis 2000;
6:51-62.
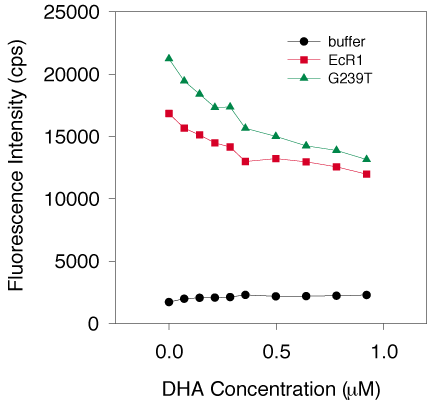
Figure 12. Binding of DHA to EcR1 and G239T
DHA was titrated into three individual preparations of 1.0 mM G239T (average represented by the green triangles) and 1.0 mM wild type EcR1 protein (red squares) and fluorescence quenching was measured by exciting at 280 nm and measuring emission at 336 nm. Background fluorescence of DHA in buffer without protein is represented by the black circles. DHA appeared to interact with G239T and EcR1 equally well. Saturable binding was defined as fluorescence above a line through the last four points of a given curve. Fluorescence below that line was taken to be nonsaturable phenomena. Thus, a rapidly decreasing component (between 0 and 0.4 mM total DHA concentration) of the difference between the binding curve and this line showed a high affinity interaction between protein and DHA. The fraction of the initial intrinsic protein fluorescence that was quenched by DHA was about 20%. This fraction was much smaller than with any other ligand in this study.
