![]() Figure 11 of
Gross, Mol Vis 2000;
6:51-62.
Figure 11 of
Gross, Mol Vis 2000;
6:51-62.
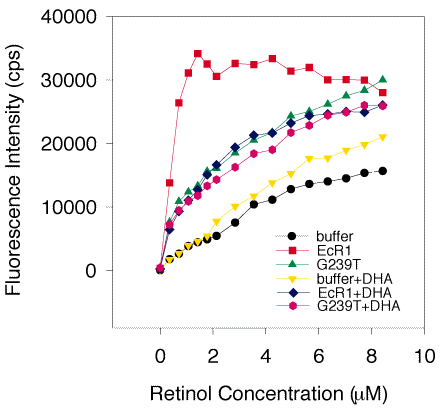
Figure 11. Effect of DHA on fluorescence enhancement of retinol
DHA (11 mM) was premixed with three individual preparations of 1.1 mM G239T (average indicated by the violet hexagons with DHA, green triangles without DHA) and 1.1 mM EcR1 (blue diamonds with DHA, red squares without DHA) and fluorescence enhancement was measured. DHA had little effect on G239T fluorescence enhancement but had a significant effect on EcR1, reducing fluorescence intensity by about 70% at 1 mM total retinol concentration. However, at higher concentrations (otherwise saturating conditions with retinol in the 7-8 mM range), the fluorescence intensity was about the same as the binding curve without DHA. Thus, the shape of the binding curve with DHA suggested that DHA was a competitive inhibitor of the retinol-EcR1 interaction. On the other hand, with or without DHA, G239T binding curves were virtually identical, suggesting little obvious effect of DHA on the interaction of retinol with G239T.
