![]() Figure 5 of
Gross, Mol Vis 2000;
6:40-50.
Figure 5 of
Gross, Mol Vis 2000;
6:40-50.
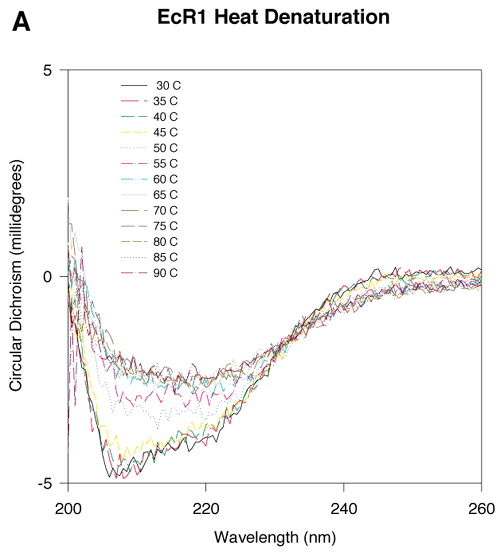
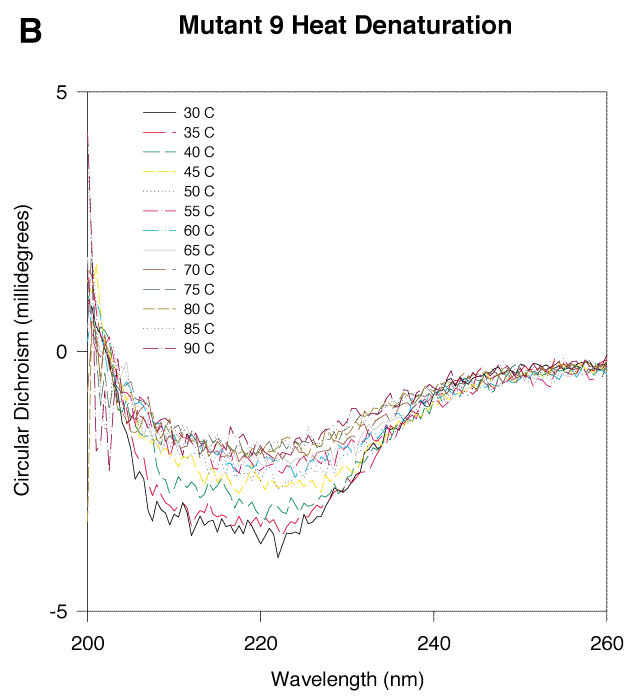
Figure 5. CD measurements of EcR1 and Mutant 9 with increasing temperature
The protein concentration of each sample was 3 mM, and the buffer was 300 mM NaCl, 50 mM NaPO4, pH 7. With increasing temperature, each protein began to denature as indicated by the decreasing magnitudes of the CD signals. Sharp changes in the magnitudes of the CD signals at 45 °C for Mutant 9 and at 60 °C for EcR1 suggested that the proteins undergo a transition from a principally native state to a mostly denatured state near these temperatures. There was a residual CD signal in both proteins even at high temperatures (85-90 °C). This signal may represent some remaining secondary structure, perhaps b-strand, which has been reported in other proteins at high temperature.

