![]() Figure 2 of
Kantorow, Mol Vis 2000;
6:24-29.
Figure 2 of
Kantorow, Mol Vis 2000;
6:24-29.
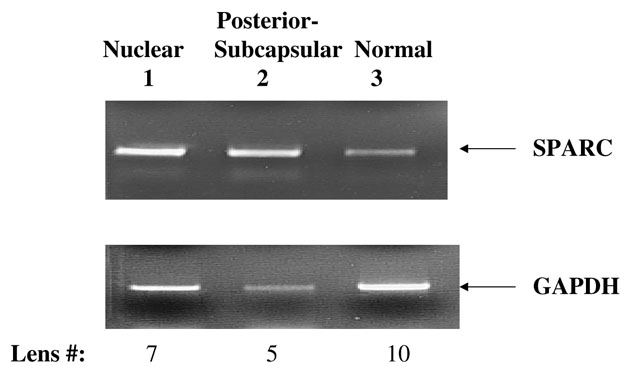
Figure 2. RT-PCR analysis of osteonectin/SPARC in specific cataracts
Ethidium bromide stained gel showing the levels of osteonectin/SPARC and GAPDH transcripts after 30 PCR cycles in nuclear cataracts (lane 1), posterior subcapsular cataracts (lane 2), and normal lenses (lane 3). The osteonectin/SPARC (419 bp) and GAPDH (600 bp) bands and the number of lenses used for each sample are indicated.