![]() Figure 4 of
Grimm, Mol Vis 2000;
6:252-260.
Figure 4 of
Grimm, Mol Vis 2000;
6:252-260.
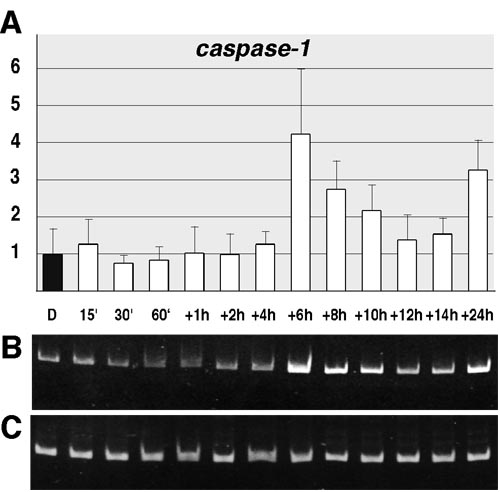
Figure 4. Relative levels of caspase-1 mRNA
Relative levels of caspase-1 mRNA in retinas of BALB/c mice as determined by exponential RT-PCR. Mice were either kept in darkness (D, black bar) or exposed to 13,000 lux of white light for 15 min (15'), 30 min (30'), 60 min (60') or to 60 min' with a subsequent recovery period in darkness of 1 h (+1h), 2 h (+2h), 4 h (+4h), 6 h (+6h), 8 h (+8h), 10 h (+10h), 12 h (+12h), 14 h (+14h) or 24 h (+24h) as indicated. Levels of caspase-1 RNA from dark control mice were set as 1. A: Average of 2 independent experiments (RNAs were isolated separately from one eye of two different mice). Each RNA of each experiment was amplified in triplicates. Bars: standard deviations of the six PCR amplifications per timepoint. RNA levels of unexposed mice (dark, D, black bar) were set as 1. B: Example amplification of caspase-1 RNA. C: Control amplification of b-actin RNA.