![]() Figure 1 of
Lyon, Mol Vis 2000;
6:199-203.
Figure 1 of
Lyon, Mol Vis 2000;
6:199-203.
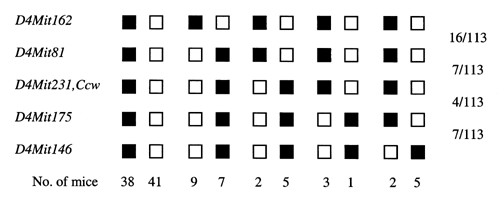
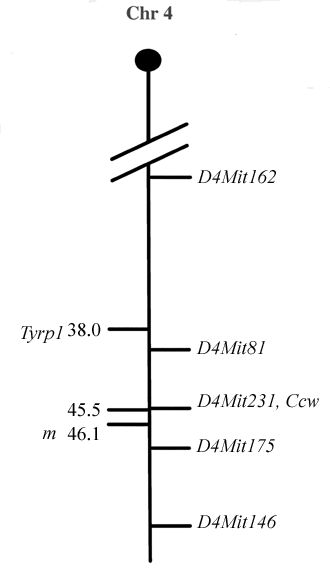
Figure 1. Chromosome mapping data for Ccw
A. Numbers of offspring typed for Ccw and microsatellite markers in a backcross of Ccw/Mus spretus females. Solid rectangles indicate laboratory mouse alleles, and open rectangles Mus spretus alleles. The number of mice of each haplotype are shown below and numbers of crossovers in each interval are shown to the right. B. Partial map of mouse chromosome 4, showing relative positions of microsatellite markers and the Ccw locus. To the left are shown the positions of the Tyrp1 and m loci, against which Ccw was mapped previously.
A.

B.
