![]() Figure 1 of
Wong, Mol Vis 2000;
6:184-191.
Figure 1 of
Wong, Mol Vis 2000;
6:184-191.
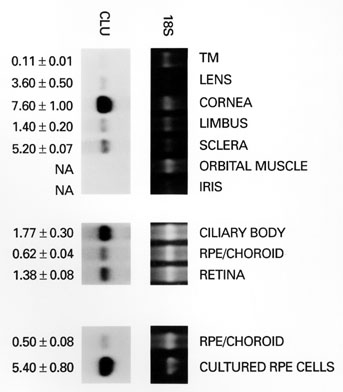
Figure 1. Clusterin mRNA levels in monkey ocular tissues
Representative northern blot analyses for clusterin expression are shown. Normalized mean clusterin values of multiple scans and standard deviations are shown below each lane. TM: trabecular mesh, RPE: retinal pigment epithelium.