![]() Figure 2 of
Simpson, Mol Vis 2000;
6:178-183.
Figure 2 of
Simpson, Mol Vis 2000;
6:178-183.
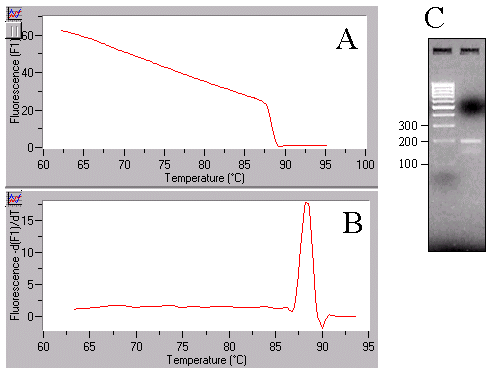
Figure 2. Specific amplification of VEGF
(A) A melt curve analysis of a VEGF amplification reaction demonstrating the gradual reduction in fluorescence as temperature increases. The rapid fall off at 87 °C indicates the presence of a specific product that melts at this temperature. The Tm of this product can be visualized more clearly as a peak in a first derivative plot (B). Agarose gel electrophoresis analysis (C) demonstrates that this peak corresponds to a single band of the size predicted 189 bp.
