![]() Figure 1 of
Simpson, Mol Vis 2000;
6:178-183.
Figure 1 of
Simpson, Mol Vis 2000;
6:178-183.
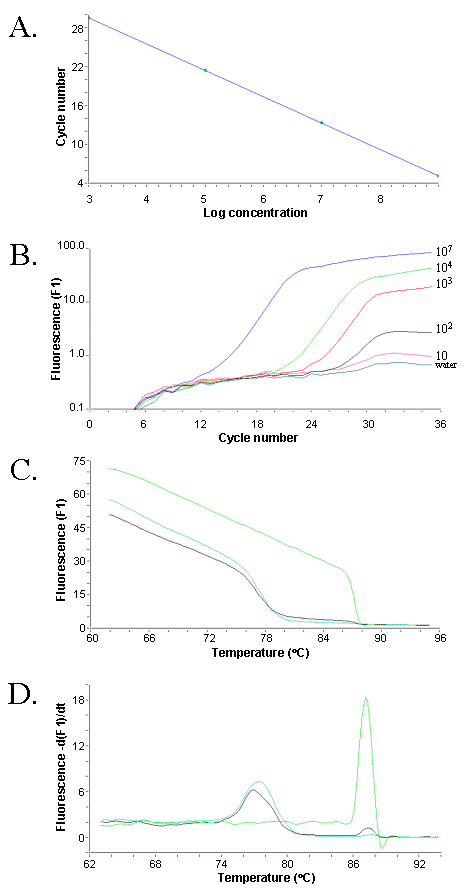
Figure 1. Amplification of VEGF dilution series
Panel A shows an example of a linear standard curve from 103 to 109 copies of VEGF (r=-1, mean squared error=0.000181). A plot of fluorescence against cycle number (B) demonstrates discrimination down to 10 copies of VEGF template DNA. To achieve this sensitivity it is necessary to measure fluorescence at several degrees below the Tm of the specific product. This avoids fluorescence from primer dimers, which may be generated at high cycle numbers in samples with very few or no target sequences (black=100 and light blue=water). These background products are indicated by the peaks present at lower temperatures in the first derivative plot (D) derived from the melting curve analysis (C).