![]() Figure 3 of
Takemoto, Mol Vis 2000;
6:164-168.
Figure 3 of
Takemoto, Mol Vis 2000;
6:164-168.
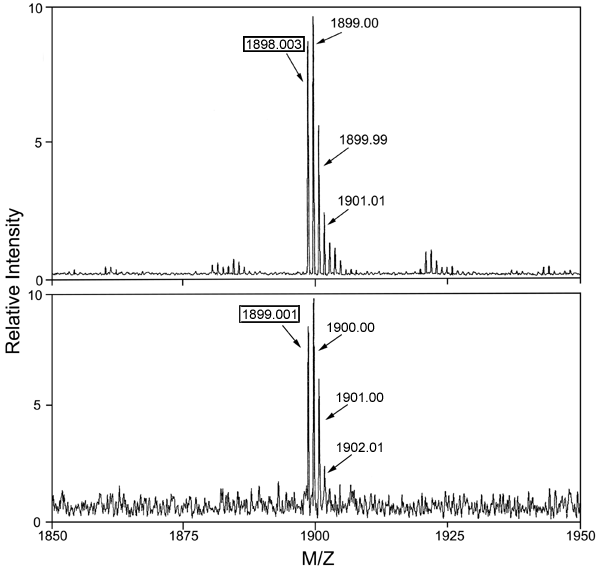
Figure 3. Mass spectral analysis
Mass spectral analyses of Peak 1 (top) and Peak 2 (bottom) are shown below. Numbers in boxes represent the monoisotopic molecular weights seen in Table 1. The remaining molecular weights represent isotopic forms of the same peptide.
