![]() Figure 4 of
Seigel, Mol Vis 2000;
6:157-163.
Figure 4 of
Seigel, Mol Vis 2000;
6:157-163.
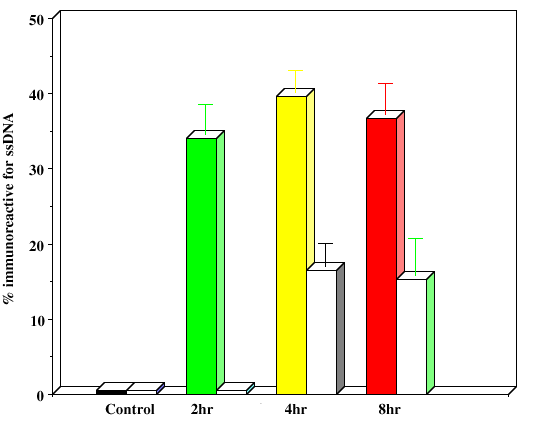
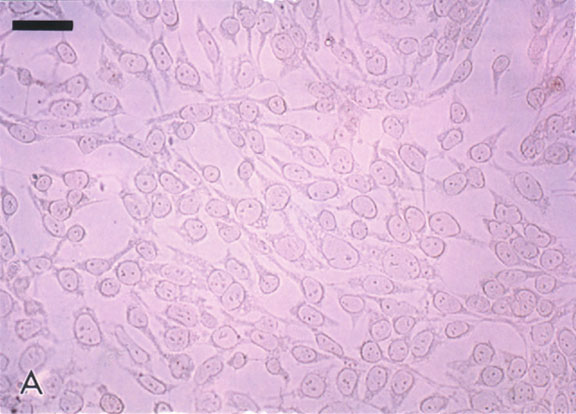
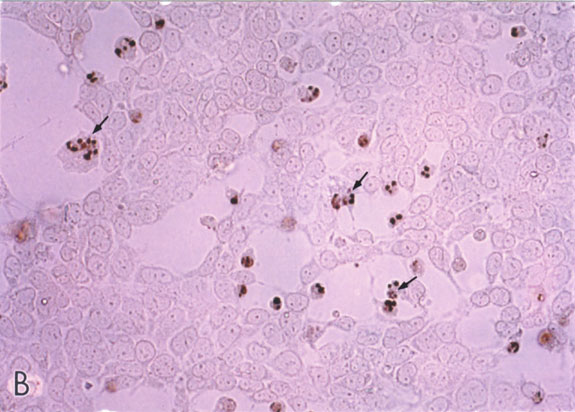
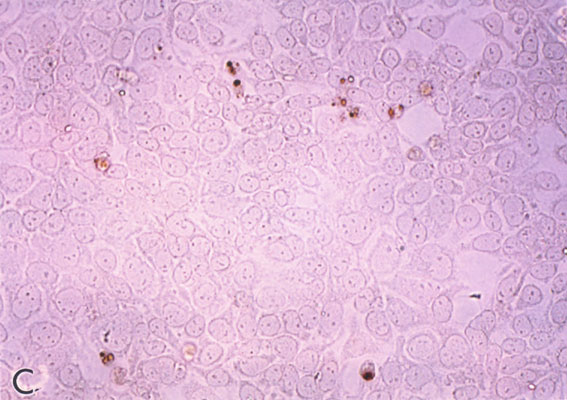
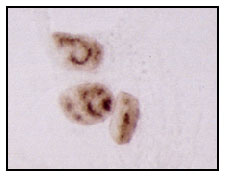
Figure 4. IGF-1 inhibits apoptotic retinal cell death
R28 cells were pre-treated for 24 h with varying concentrations of IGF-1 (0, 10, 50, and 100 ng/ml). R28 cells remained in IGF-1-containing medium and then subjected to hypoxia (95% N2/5% CO2) for up to 8 h. Cells on coverslips were fixed in PBS-Methanol at 2 h intervals and analyzed by the apoptosis-specific Apostain method for detecting ssDNA. Panel A shows normoxic R28 cells with no ssDNA staining; magnification bar = 10 mm. In panel B, numerous darkly-stained ssDNA-positive cells are visible after 8 h of hypoxia. In panel C, the cells were pre-treated with 50 ng/ml of native IGF-1 prior to 8 h hypoxia treatment. Note the relative health of these cells as compared with panel B. Panel D is a higher magnification demonstrating clumpy chromatin stained with ssDNA antibody within apoptotic cell nuclei. In panel E, the number of ssDNA-reactive cells were counted at 2 h intervals and presented graphically. Colored bars are control cell counts; white bars are IGF-1 treated cell counts. Error bars indicate standard deviations. There were statistically significant differences in cell survival with IGF-1 at 2, 4, and 8 h (p<0.05)
A.
B.
C.
D.
E.