![]() Figure 1 of
Cai, Mol Vis 2000;
6:132-143.
Figure 1 of
Cai, Mol Vis 2000;
6:132-143.
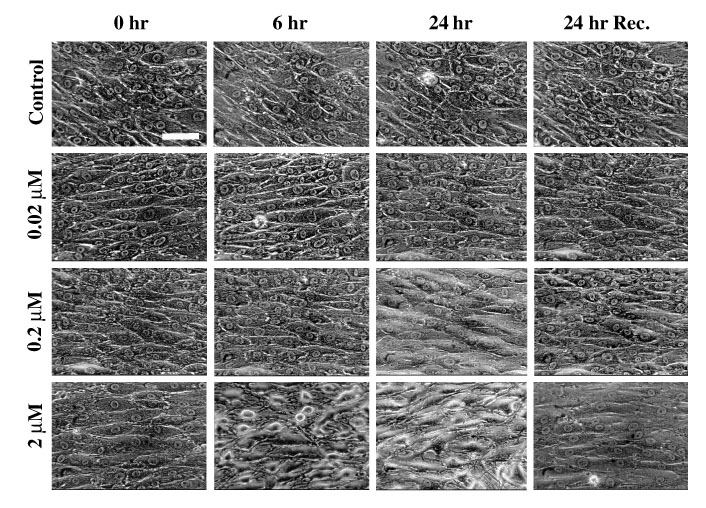
Figure 1. Effect of LAT-A on HTM cell morphology over time
Videographic recording of HTM cell morphology after treatment with 0, 0.02, 0.2 and 2 mM LAT-A for 0, 6, and 24 h, and recovery for another 24 h. For each dose, the same field of cells was recorded at each time point. At 1, 6, 11, and 24 h at 0.02 mM LAT-A, cell morphology appeared unchanged. At 0.2 mM LAT-A, cells appeared slightly rounded at 24 h. At 2 mM LAT-A, cells showed time-dependent morphological changes including cell rounding and separation. Recovery at all doses seemed almost complete after 24 and 48 h in LAT-A-free medium. Data for 1 and 11 h treatment and 48 h recovery are not shown. Bar = 80 mm.