![]() Figure 3 of
Yeagle, Mol Vis 2000;
6:125-131.
Figure 3 of
Yeagle, Mol Vis 2000;
6:125-131.
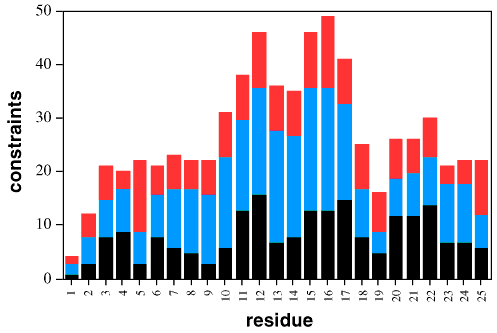
Figure 3. Categories of constraints from NOESY data
Bar graph of the categories of constraints obtained from the NOESY data for the family in Figure 5B of rhoviih. Black bars represent intraresidue constraints, blue bars represent sequential constraints, and red bars represent long range constraints.
