![]() Figure 4 of
Ablonczy, Mol Vis 2000;
6:109-115.
Figure 4 of
Ablonczy, Mol Vis 2000;
6:109-115.
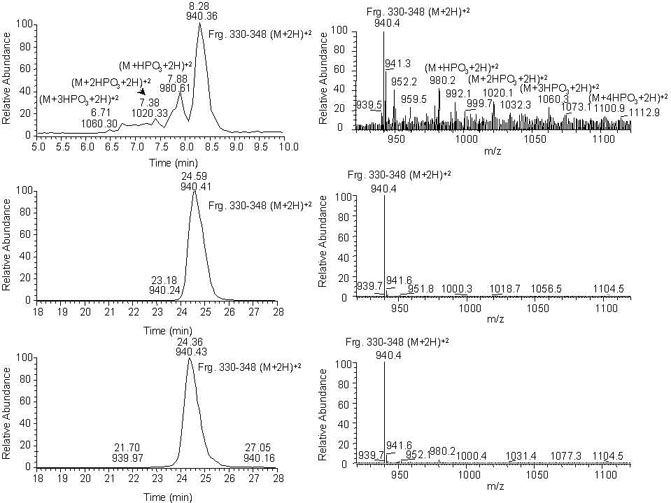
Figure 4. Light damage phosphorylation of rat rhodopsin
Base peak chromatograms (left) and mass spectra (right) from Asp-N cleaved C terminal fragments of rhodopsin are shown. The sample shown at the top was extracted from cyclic dim light reared light damaged and not dark-adapted animals. The one in the middle is cyclic dim light reared control, and the one below is cyclic dim light reared light damaged and 24 h dark-adapted. Notice the amount of phosphorylation on the first sample. Three sites of phosphorylation are confirmed with MS/MS data (not shown). No sequence information was obtained for the tetraphosphorylated species. There were multiple mono- and diphosphorylation species. Notice that dark adaptation completely reverses phosphorylation. The difference between the time scale and the sensitivity of the modified and unmodified samples was due to differences in experimental conditions.