![]() Figure 2 of
Haque, Mol Vis 1999;
5:8.
Figure 2 of
Haque, Mol Vis 1999;
5:8.
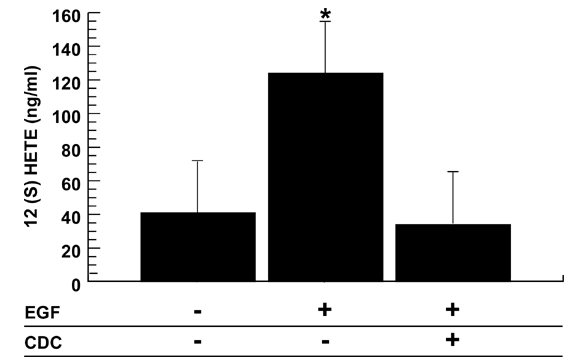
Figure 2. Release of 12(S) HETE by N/N1003A cells
Cells were deprived of serum for 48 h and then stimulated with EGF for 24 h. CDC (10 µM), when present, was added 40 min prior to EGF. Results are the average of three measurements; error bars represent the standard error of the mean (SEM). The asterisk (*) indicates a statistically significant difference (p<0.05,two tailed t-test).
