![]() Figure 12 of
Kuszak, Mol Vis 1999;
5:7.
Figure 12 of
Kuszak, Mol Vis 1999;
5:7.
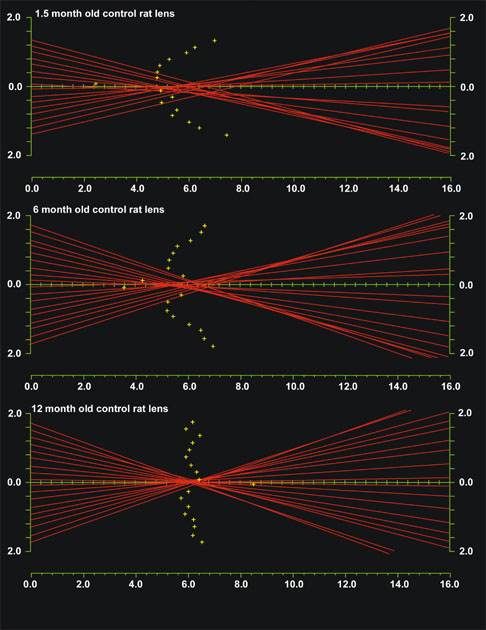
Figure 12. Plots of laser scan analysis through 1.5, 6, and 12 month old control rats.
Consider the standard map of laser penetration points directed into a rat lens by our low power helium-neon laser scan analysis as shown previously in Figure 1B. If the lens is turned 90° on its equatorial axis, the variable focal lengths of the eighteen laser beams can be represented as they are reflected or refracted by the lens. The vertical axis indicates laser beam position (mm) from the optical center (0, 0) of the lens. The horizontal axis indicates equivalent focal length (mm). Plus (+) signs indicate the focal lengths for each incident laser beam as a function of distance from the optical center.
In the rat lens, optics are maximal at 6 months of age. By 12 months the negative effects of aging are apparent (see Table 1, Table 2, and Table 3).