![]() Figure 5 of
Al-Ghoul, Mol Vis 1999;
5:6.
Figure 5 of
Al-Ghoul, Mol Vis 1999;
5:6.
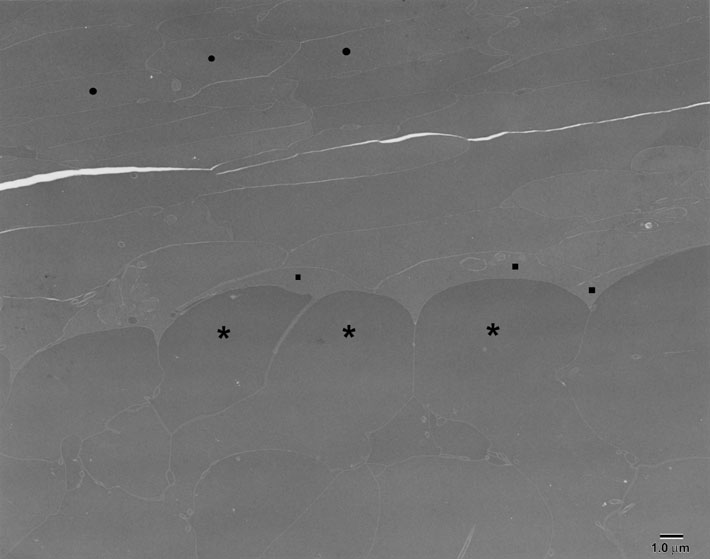
Figure 5. Transmission electron micrograph of the internalized PSC at 3 months postnatal.
A low magnification overview demonstrates the enlarged, ovate ends of fibers in the plaque (asterisks), the thin, irregular fibers that covered the plaque (squares) and the flattened hexagonal profiles of relatively normal fibers from more external growth shells (black dots).