![]() Figure 6 of
Winkler, Mol Vis 1999;
5:32.
Figure 6 of
Winkler, Mol Vis 1999;
5:32.
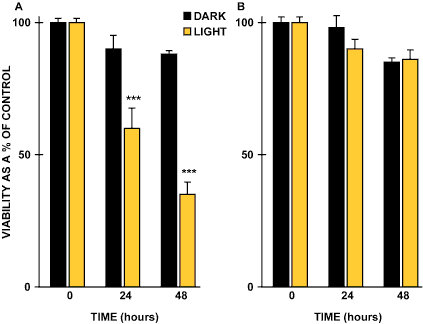
Figure 6. Histogram demonstrating the phototoxicity of lipofuscin
Lipofuscin-fed RPE cells were either maintained in the dark (black bars) or exposed to light (gold bars): A. blue light (400-550 nm); B. amber light (550-800 nm) for up to 48 h. Cell viability was determined using the MTT assay [47]. Vertical bars represent standard error of the mean.
