![]() Figure 6 of
Cai, Mol Vis 1999;
5:3.
Figure 6 of
Cai, Mol Vis 1999;
5:3.
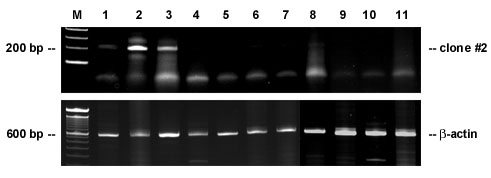
Figure 6. RT-PCR analysis of clone 2 mRNA expression in lens and non-lens tissues.
Total RNA (1 µg) was used for RT-PCR, and 20 µl out of the 50 µl PCR reaction mixture were used for electrophoresis. The PCR products were visualized by staining with ethidium bromide. Lane 1: cornea; Lane 2: lens epithelial cells; Lane 3: lens fiber cells; Lane 4: brain; Lane 5: intestine; Lane 6: kidney; Lane 7: liver; Lane 8: muscle; Lane 9: ovary; Lane 10: spleen; Lane 11: testis. RT-PCR yielded substantial product from RNA isolated from lens epithelial cells (Lane 2), but less from lens fiber cells (Lane 3). Trace amounts were obtained in reactions with cornea mRNA (Lane 1), but not with other tissues tested.