![]() Figure 6 of
Park, Mol Vis 1999;
5:18.
Figure 6 of
Park, Mol Vis 1999;
5:18.
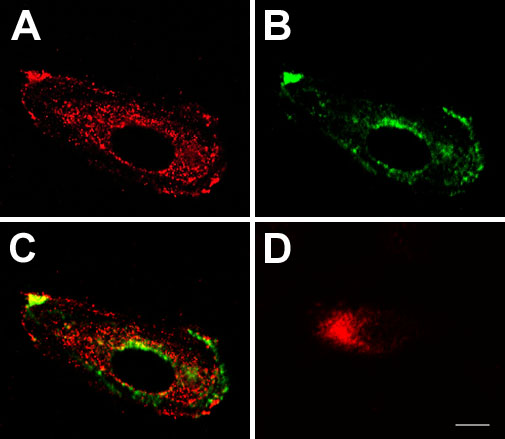
Figure 6. Colocalization of GST-(SH2)2 and FGF receptors
CEC were microinjected with GST-(SH2)2. Two h after injection, cells were treated with FGF-2 (10 µg/ml) supplemented with heparin (10 µg/ml) for an additional 4 h. Cells were then fixed, permeabilized, and stained with anti-GST and anti-FGF receptor I (Flg) antibodies as described in the text. Red signals are GST-positive (A); green signals are FGF receptor-positive (B); yellow signals show the colocalization of GST-(SH2)2 and FGF receptors (C). D, the microinjected GST-(SH2)2 in the absence of FGF-2 stimulation. Data are representative of three microinjection experiments. Bar, 10 µm.