![]() Figure 5 of
Semple-Rowland, Mol Vis 1999;
5:14.
Figure 5 of
Semple-Rowland, Mol Vis 1999;
5:14.
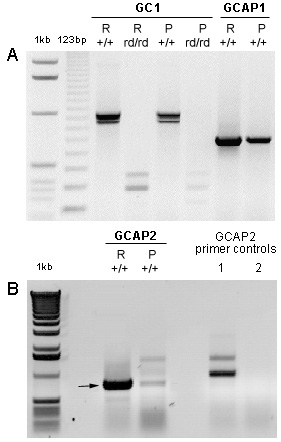
Figure 5. RT-PCR analyses of GC1, GCAP1, and GCAP2
A. Analyses of GC1 and GCAP1 in normal and rd/rd retina and pineal. Primers used to amplify GC1 flank the deletion previously described in GC1 in the rd chicken. Two GC1 products were amplified in both retina and pineal, the larger representing an alternatively spliced form of the GC1 transcript present in chicken [21]. B. Analyses of GCAP2 in normal retina and pineal. The arrow indicates the GCAP2 product, the identity of which was verified by sequence analyses. GCAP2 RT-PCR control experiments indicated that the additional products in the pineal sample were due to non-specific priming activity of GCAP2 primer 59 (GCAP2 primer control, lane 1). No products were obtained using GCAP2 primer 164 alone (GCAP2 primer control, lane 2). Each lane is labeled with either an R (retina) or P (pineal) and +/+ (normal chicken) or rd/rd (mutant chicken) indicating the source and type of tissue from which the sample was obtained. DNA size ladders (1 kb and 123 bp) are shown in the left most lanes of each gel.