![]() Figure 8 of
Uchida, Mol Vis 5:1, 1999.
Figure 8 of
Uchida, Mol Vis 5:1, 1999.
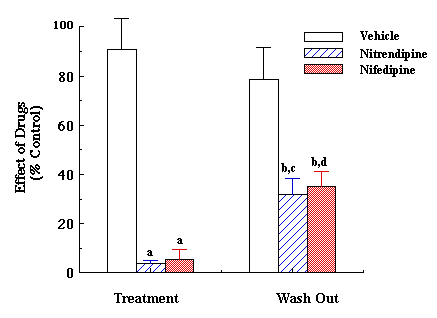
Figure 8. The K+-evoked increase of [Ca2+]in is blocked by 3 µM nitrendipine and 10 µM nifedipine.
The bar graphs show the [Ca2+]in response to K+ of the second stimulation period (Treatment) and third stimulation period (Wash Out) expressed as a percentage of the first stimulation period. Vehicle, nifedipine, and nitrendipine were present from 10 min prior to the second stimulation until its end. The Ca2+ channel blockers reduced the response to K+ by greater than 90%. The response partially recovered upon washout for 10 min. N = 8 per group. (a) p <0.01 for comparison to Vehicle Treatment; (b) p <0.01 for comparison to Vehicle Washout; (c) p <0.05 for comparison to Nitrendipine Treatment; p <0.05 for comparison to Nifedipine Treatment.
