![]() Figure 1 of
Sinha, Mol Vis 4:8, 1998.
Figure 1 of
Sinha, Mol Vis 4:8, 1998.
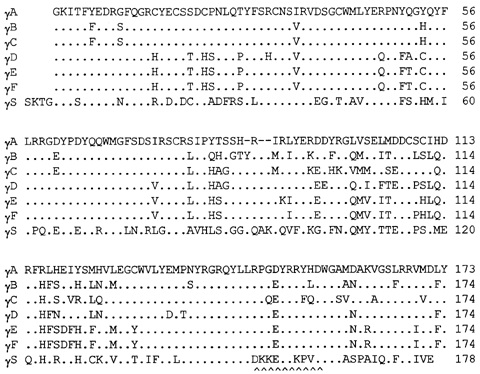
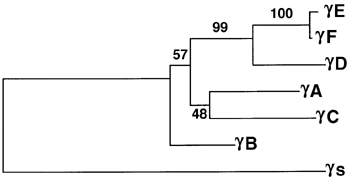
Figure 1. The Mouse [gamma]-crystallin family
A. Alignment of protein sequences for the complete mouse [gamma]-crystallin family, including [gamma]S. Identity with [gamma]A is shown by a dot, gaps are shown by dashes. The position of the peptide chosen for antiserum production is indicated under the [gamma]S sequence.

B. Cladogram of the mouse [gamma]-crystallin family. Numbers show the bootstrap values, a measure of the confidence level, for each branchpoint. Multiple replications of the analysis are performed using different samples of the alignment. The bootstrap values are the percentage of these analyses which generate each branchpoint. This is to test against bias resulting from a small number of matches or mismatches [29].The distance calculations upon which this cladogram is based place [gamma]S as the outgroup and as such it has no bootstrap value.
