![]() Figure 5 of
Qian, Mol Vis 4:6, 1998.
Figure 5 of
Qian, Mol Vis 4:6, 1998.
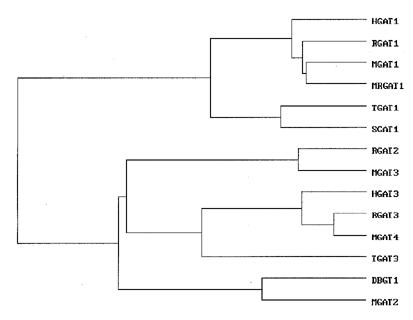
Figure 5. Dendrogram of a multiple amino acid sequence alignment of all the GABA transporter sequences available in the database.
The alignment was created with Clustal program of PCGene. The dendrogram plots the similarity of the sequences to each other based on the Dayhoff MDM-78 amino acid similarity matrix. The distances of the horizontal lines represent the similarity of one GABA transporter compared to next one. (HGAT: human brain; RGAT: rat brain; MGAT: mouse brain; MRGAT: mouse retina; TGAT: Torpedo electromotor nucleus; SGAT-1: skate retina; DBGT: dog betaine/GABA transporter).