![]() Figure 3 of
Qian, Mol Vis 4:6, 1998.
Figure 3 of
Qian, Mol Vis 4:6, 1998.
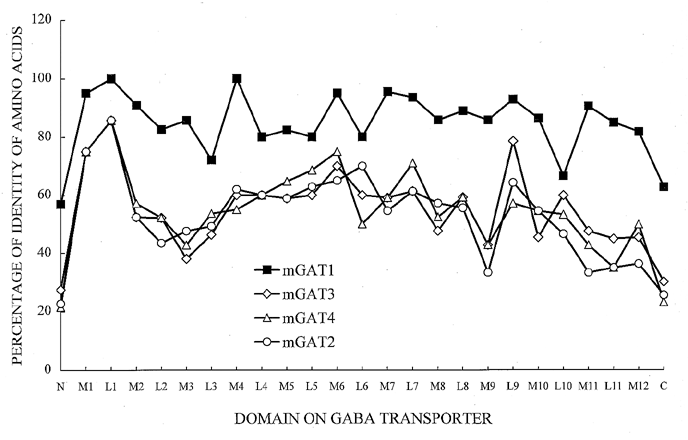
Figure 3. Percentage of amino acid identity of each domain of SGAT-1 compared to mouse GAT-1-4.
Each domain of SGAT-1 (N and C termini, transmembrane domain M1-12 and loop L1-11) was aligned with mouse GAT-1-4 respectively. The percent of identical amino acids was calculated by PCGene.
