![]() Figure 2 of
Hopp, Mol Vis 4:5, 1998.
Figure 2 of
Hopp, Mol Vis 4:5, 1998.
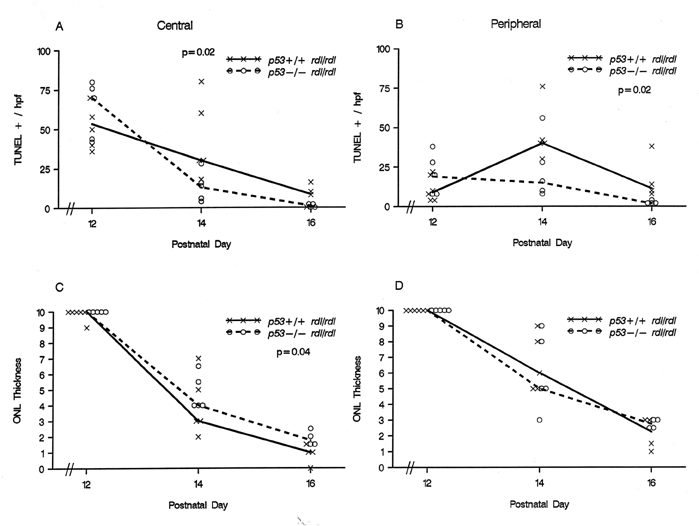
Figure 2. Time course of retinal degeneration in p53+/+ rd1/rd1 and p53-/- rd1/rd1 mice.
A minimum of 4 mice were examined for each genotype analyzed at each age (P12, P14, and P16). Each datapoint plotted in a given panel represents the average of counts from two high power fields from one eye of an individual animal. Both indices, TUNEL + cells/hpf (A and B) and ONL thickness (C and D), indicate that the retinal degeneration occurring in the p53+/+ rd1/rd1 and p53-/- rd1/rd1 mice follows a similar rate of rod cell destruction in the central and peripheral retina. Small significant differences were detected, however, and are indicated by the p values denoted in A, B, and C (Wilcoxon Rank Sum test within each time point). Solid or dashed lines connect the median values for each genotype.
