![]() Figure 8 of
Nickerson, Mol Vis 4:33, 1998.
Figure 8 of
Nickerson, Mol Vis 4:33, 1998.
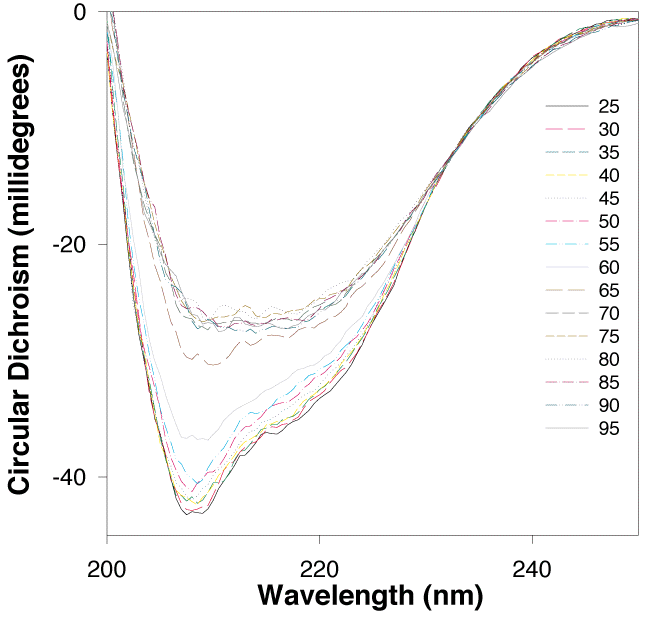
Figure 8. CD Spectral Temperature Ramp Thermal denaturation
A sample of EcR1 at 0.66 mg/ml protein in 5 mM NaPO4 pH 6.5, was analyzed from 250 to 200 nm. Ellipticities in mDeg are shown on the ordinate. CD scans of the same sample were made following 5 °C temperature increases from 25 to 95 °C. A distinct transition from one structural state (native) to another (partially denatured) is detected at 60-65 °C, indicated on the figure by the widest spacing (and biggest change in CD) between scans at these two different temperatures.