![]() Figure 7 of
Nickerson, Mol Vis 4:33, 1998.
Figure 7 of
Nickerson, Mol Vis 4:33, 1998.
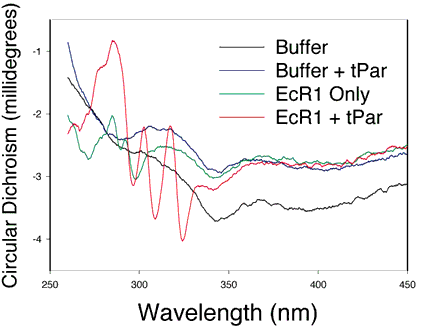
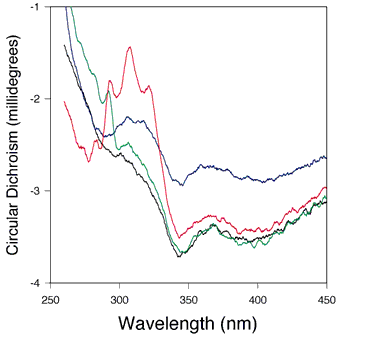
Figure 7. Ligand binding to EcR1: Effect of binding on the CD spectra in the near UV range
A. Trans-parinaric acid binds to EcR1 and complex exhibits profoundly altered CD signals in tryptophan and parinaric acid absorbing regions of the spectra. These additional peaks and valleys in the spectra suggest that tryptophan and parinaric acid are nearby in the bound complex in the binding site.

B. Similar effects are detected in the EcR3-trans-parinaric acid complex. No such changes were detected with EcR2 or EcR4. Conditions for the assay are described in Methods. On both panels, black designates the CD spectrum of buffer only. Blue indicates trans-parinaric acid in buffer. Green denotes protein in buffer. Red represents protein and trans-parinaric acid equilibrated before scanning.
