![]() Figure 4 of
He, Mol Vis 4:32, 1998.
Figure 4 of
He, Mol Vis 4:32, 1998.
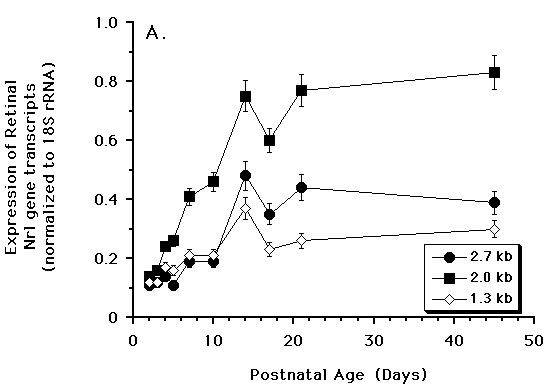
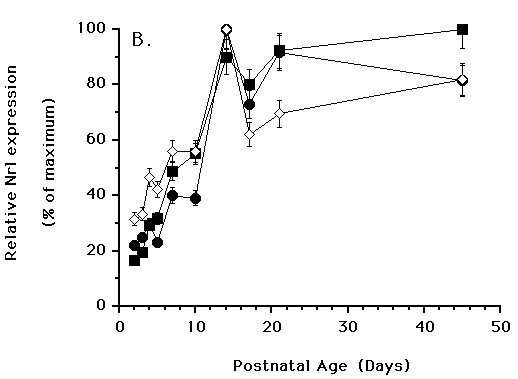
Figure 4. Quantitative analysis of developmental expression of mRNAs for Nrl transcripts in rat retinas
The optical density of the 2.7, 2.0, and 1.3 kb Nrl mRNA transcripts were determined and normalized for equal loading by comparison with 18S rRNA. The optical densities were determined at each age for each transcript and (A) plotted as relative percent of gene expression±SEM and (B) normalized to the maximal level of gene expression, then plotted as maximal expression per transcript±SEM. Five to seven blots, from independent samples, were analyzed at each age.

