![]() Figure 7 of
Kay, Mol Vis 4:22, 1998.
Figure 7 of
Kay, Mol Vis 4:22, 1998.
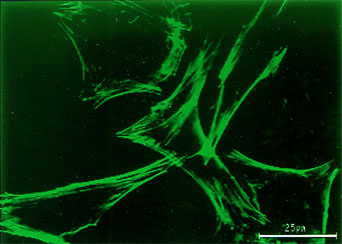
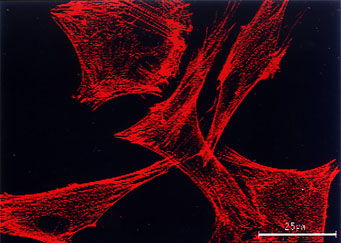
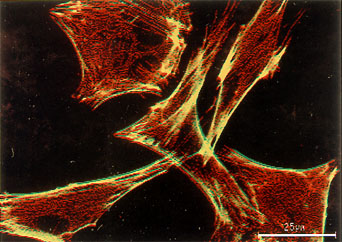
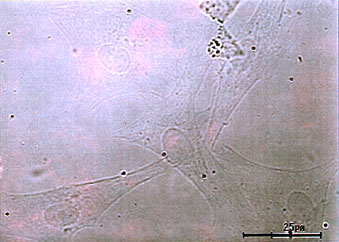
Figure 7. Colocalization of F-actin and [alpha]-actinin in modulated CECs
Modulated cells were induced with treatment of FGF-2, and staining procedures were described in Figure 6 and in the text. Fluorescein signals (green) are F-actin positive, rhodamine signals (red) are [alpha]-actinin positive, and yellow signals show the colocalization of F-actin and [alpha]-actinin. The last panel is a phase-contrast image. (bar = 25 µm)