![]() Figure 1 of
Kannabiran, Mol Vis 4:21, 1998.
Figure 1 of
Kannabiran, Mol Vis 4:21, 1998.
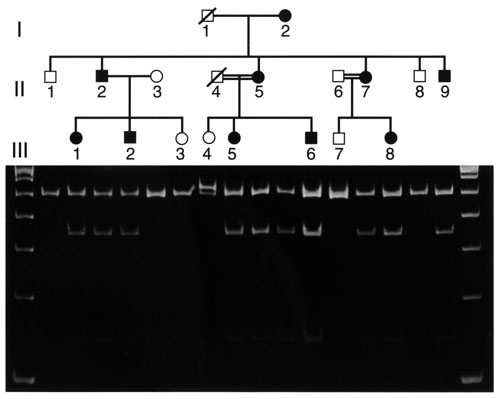
Figure 1. Pedigree and restriction endonuclease analysis for the G to A transition of the family described by Basti [18]
NlaIII digestions of PCR products are shown below each surviving individual in the pedigree. The first and last lanes are 100 bp ladders. The largest cleavage product, 488 bp, results from presence of the wild type sequence, while the cleaved products, 346 and 142 bp, indicate presence of the mutant sequence. In individual III-4 and to a lesser extent in individual II-8 a 520 bp band representing the PCR product partially digested with NlaIII is visible. No DNA sample was received from individual II-6, who has no corresponding lane on the gel. Individual III-7 was analyzed and the results are shown vertically below both II-6 and III-7.