![]() Figure 7 of
El-Kabbani, Mol Vis 1998;
4:19.
Figure 7 of
El-Kabbani, Mol Vis 1998;
4:19.
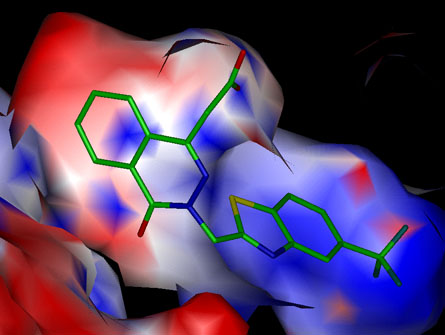
Figure 7. Surface charges of the inhibitor-binding site
Distribution of surface charges in the inhibitor-binding sites of ALR1 (A) and ALR2 (B) with the inhibitors bound. The surface of each inhibitor binding-site is colored according to the type of charge present (negative in red, positive in blue, neutral in white). The apolar surfaces interact with the hydrophobic domains of the inhibitor while the polar surfaces may engage in ionic interactions with the bound inhibitor. Excellent charge complementarity exists between the carboxylate group of the bound inhibitor and the enzyme. Figures were prepared using INSIGHT II (Biosym Technologies Inc., San Diego, CA).
(A) ALR1
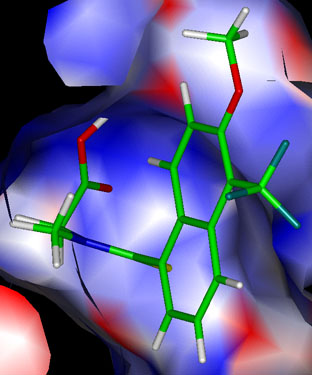
(B) ALR2