![]() Figure 2 of
Tucker, Mol Vis 4:18, 1998.
Figure 2 of
Tucker, Mol Vis 4:18, 1998.
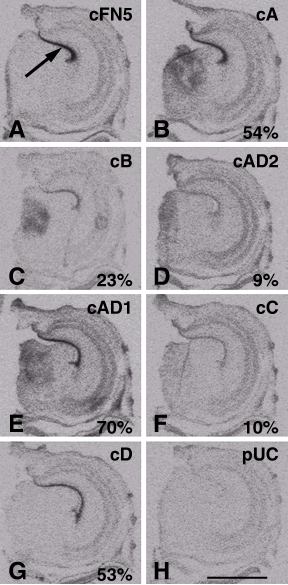
Figure 2. Tenascin-C Variants in the Optic Tectum
High-resolution X-ray film overlays of cross sections through the E10 quail optic tectum hybridized with a probe that recognizes all tenascin-C transcripts (A) or only transcripts encoding a specific variable repeat (B-G). A pUC control for spurious labeling and probe trapping is also shown (H). The strongest signal in the E10 optic tectum is within the ventricular zone (arrow). The probe used for each image is shown in the upper right-hand corner. The result of densitometric analysis of the films (shown as a percentage of the cFN5 signal; n = 3) is shown in the lower right-hand corner. The bar corresponds to 1 mm.