![]() Figure 2 of
Kantorow, Mol Vis 4:17, 1998.
Figure 2 of
Kantorow, Mol Vis 4:17, 1998.
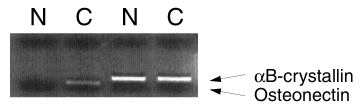
Figure 2. Confirmation of osteonectin over-expression between RNAs isolated from cataractous (C) and normal (N) samples
Ethidium bromide stained gel showing the levels of osteonectin in 50 ng of pooled normal RNA (lane 1) and 50 ng of pooled cataract RNA (lane 2) measured by RT-PCR after 30 PCR cycles. Shown as control are the levels of [alpha]B-crystallin in the normal (lane 3) and cataract (lane 4) samples amplified identically. Arrows indicate the positions of the 547 bp [alpha]B-crystallin control product and the 419 bp osteonectin product.