![]() Figure 1 of
Kantorow, Mol Vis 4:17, 1998.
Figure 1 of
Kantorow, Mol Vis 4:17, 1998.
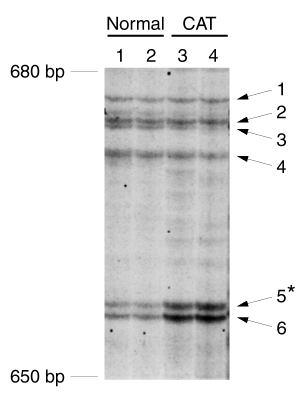
Figure 1. Identification of osteonectin as differentially displayed between cataractous and normal human lenses
(A) Autoradiogram of the reverse transcriptase-PCR differential display gel using duplicate RNA samples isolated from cataractous (CAT, lanes 3 and 4) and normal (lanes 1 and 2) lens epithelia. Arrows indicate displayed bands (numbered) in the cataract and the normal samples. The differentially displayed band (number 5) that was further analyzed is marked with an asterisk.
(B) Sequence alignment of differentially displayed band 5 with human osteonectin. The upper sequence is that determined for differential display band 5; the lower sequence is that reported for osteonectin. Numbering is from the start of translation. A one base-pair mismatch between the sequence of differential display band 5 and the reported sequence for osteonectin is shown in red.
+1995 ->
CTCCAAGCATTTCATGAAAAAGCTGCTTCTTATTAATCATACAAACTCTCACC
-----------------------------------------------------
CTCCAAGCATTTCATGAAAAAGCTGCTTCTTATTAATCATACAAACTCTCACC


ATGATGTGAAGAGTTTCACAAATCCTTCAAAATAAAAAGTAATGACTT
------------------------------------------------
ATGATGTGAAGAGTTTCACAAATCTTTCAAAATAAAAAGTAATGACTT
                                        <- +2095
|