![]() Figure 3 of
Townes-Anderson, Mol Vis 4:12, 1998.
Figure 3 of
Townes-Anderson, Mol Vis 4:12, 1998.
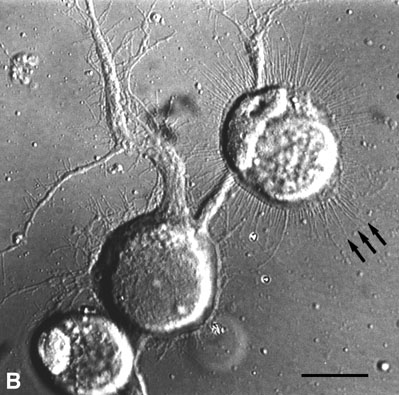
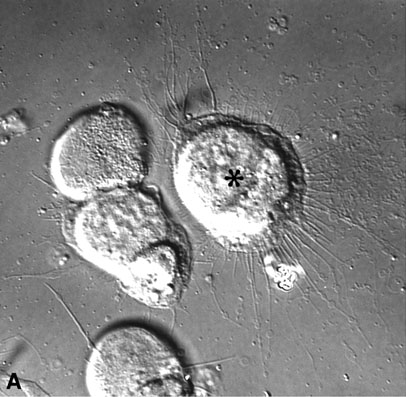
Figure 3. Trapped cells exhibit normal growth
(A) Cells which had been trapped for many minutes, attached to the culture substrate and exhibited normal process outgrowth. Asterisk (*) indicates a rod cell which had been trapped and positioned next to two other cells. The culture was fixed after 2 days in vitro.
(B) Rod cells, from the same culture, which had not been optically trapped and repositioned showed very similar growth patterns to moved cells. In this cell, arrows indicate the presence of multiple filopodial processes after 2 days; compare with trapped cell in A. Bar = 15 µm.