Figure 5. Gene count plots for arrdc2 and mss51. A: Gene count plot for arrdc2 across all genotypes for gene expression in EOM. Each point represents a single sample from each of the 5 genotypes. Note
that the y-axis is a log scale. These were created using a DESeq program in R. Arrdc2 expression is downregulated in the EOM of all albino and hypopigmented mice compared to the C57Bl/6 pigmented control mice. B: Gene count plot for mss51 across all genotypes for gene expression in EOM. Each point represents a single sample from each of the 5 genotypes. Note
that the y-axis is a log scale. These were created using a DESeq program in R. Mss51 is upregulated in the EOM of all albino and hypopigmented mice compared to the C57BL/6 pigmented control mice.
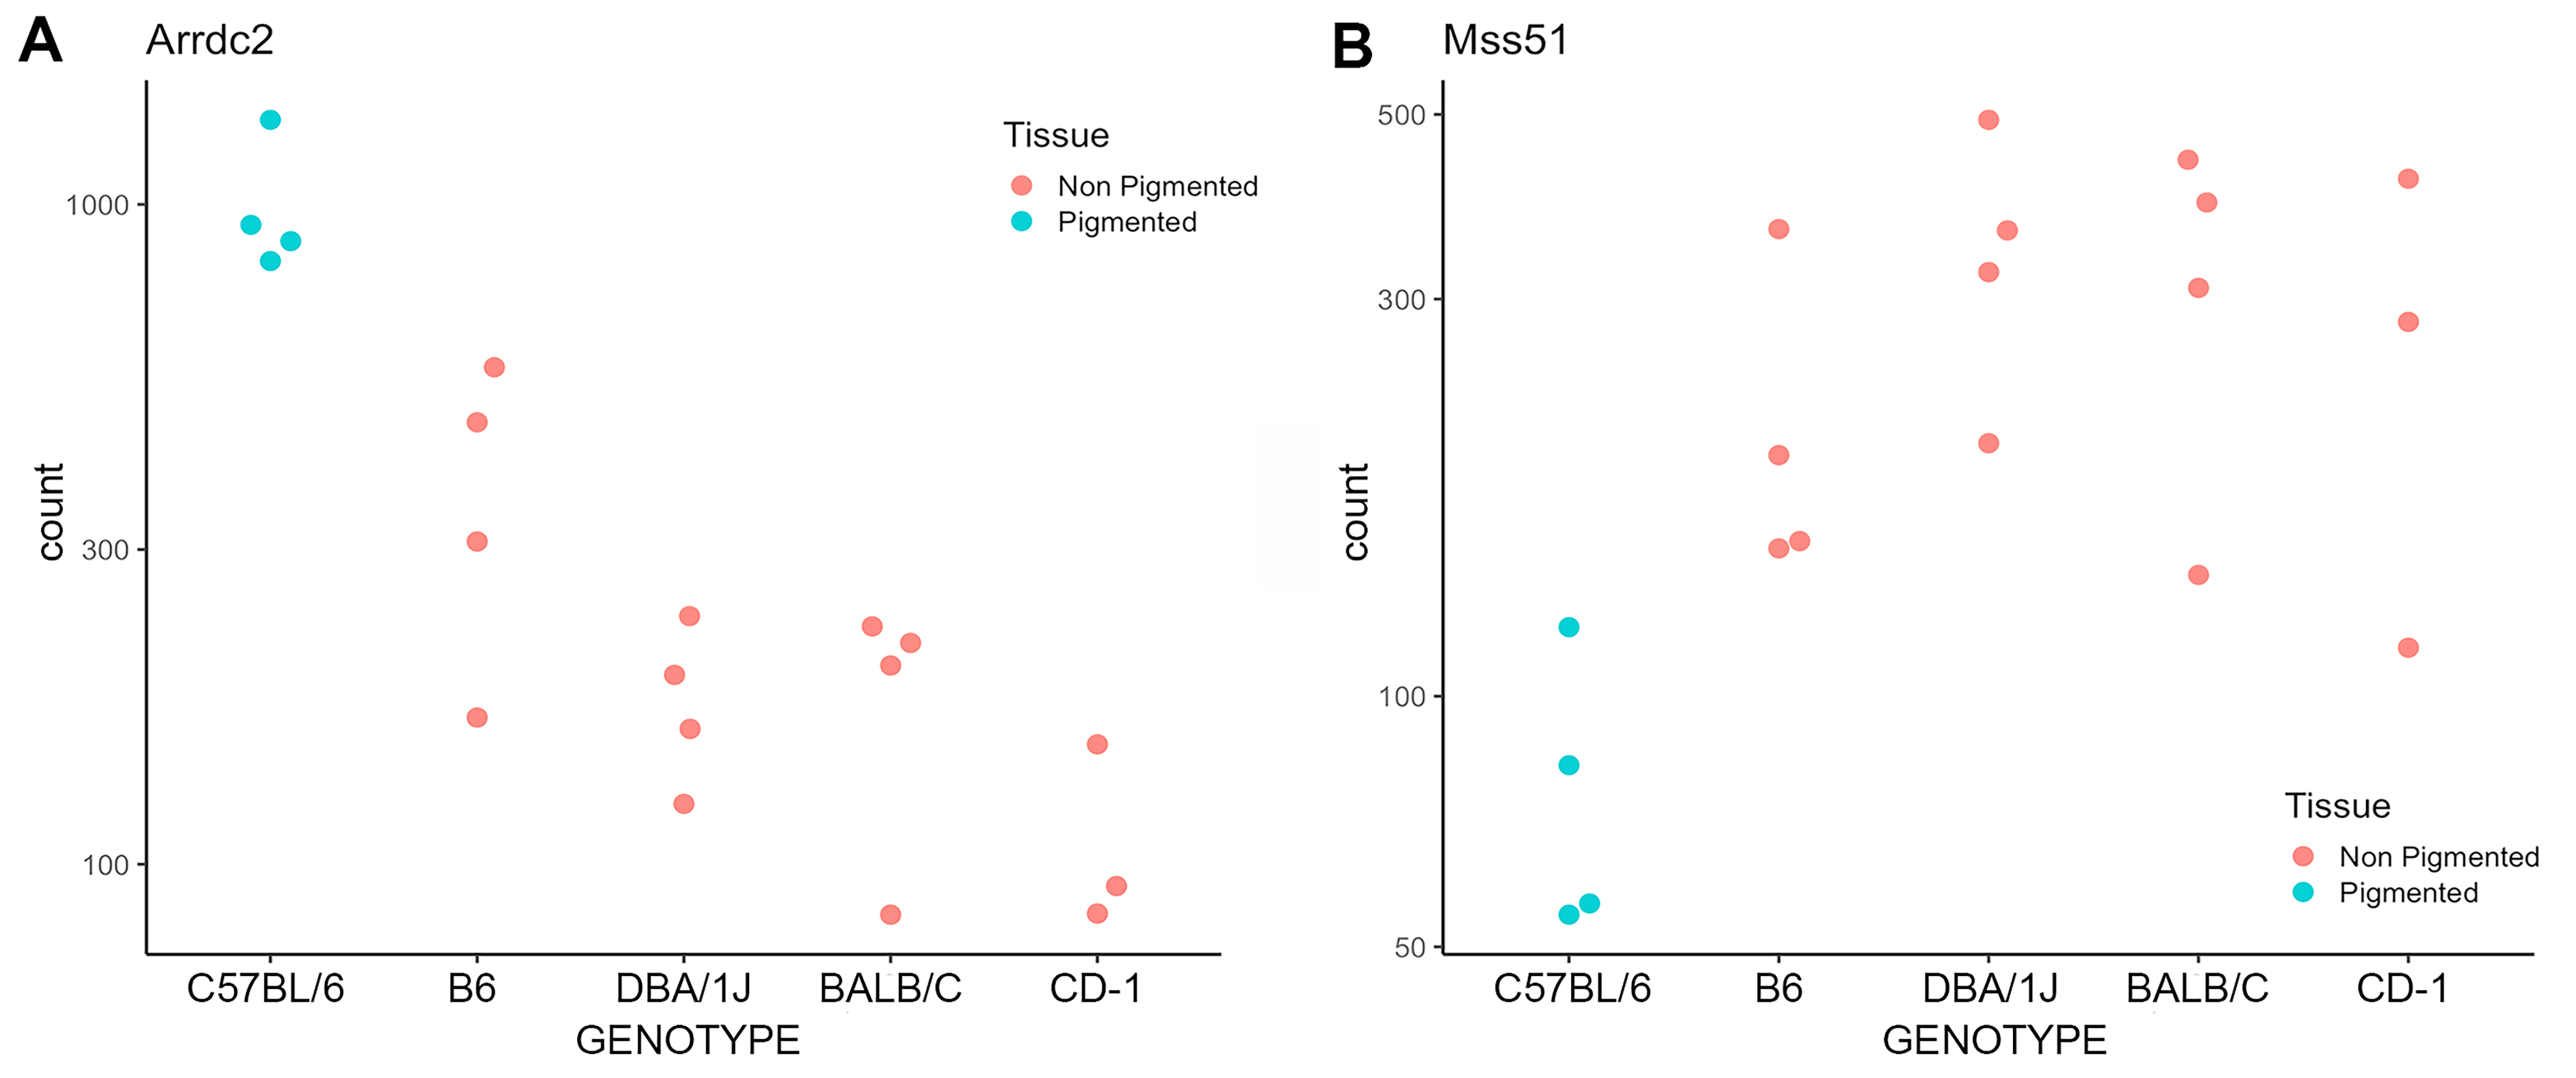
 Figure 5 of
Johnson, Mol Vis 2026; 32:472-485.