Figure 4 of
Johnson, Mol Vis 2026; 32:472-485.
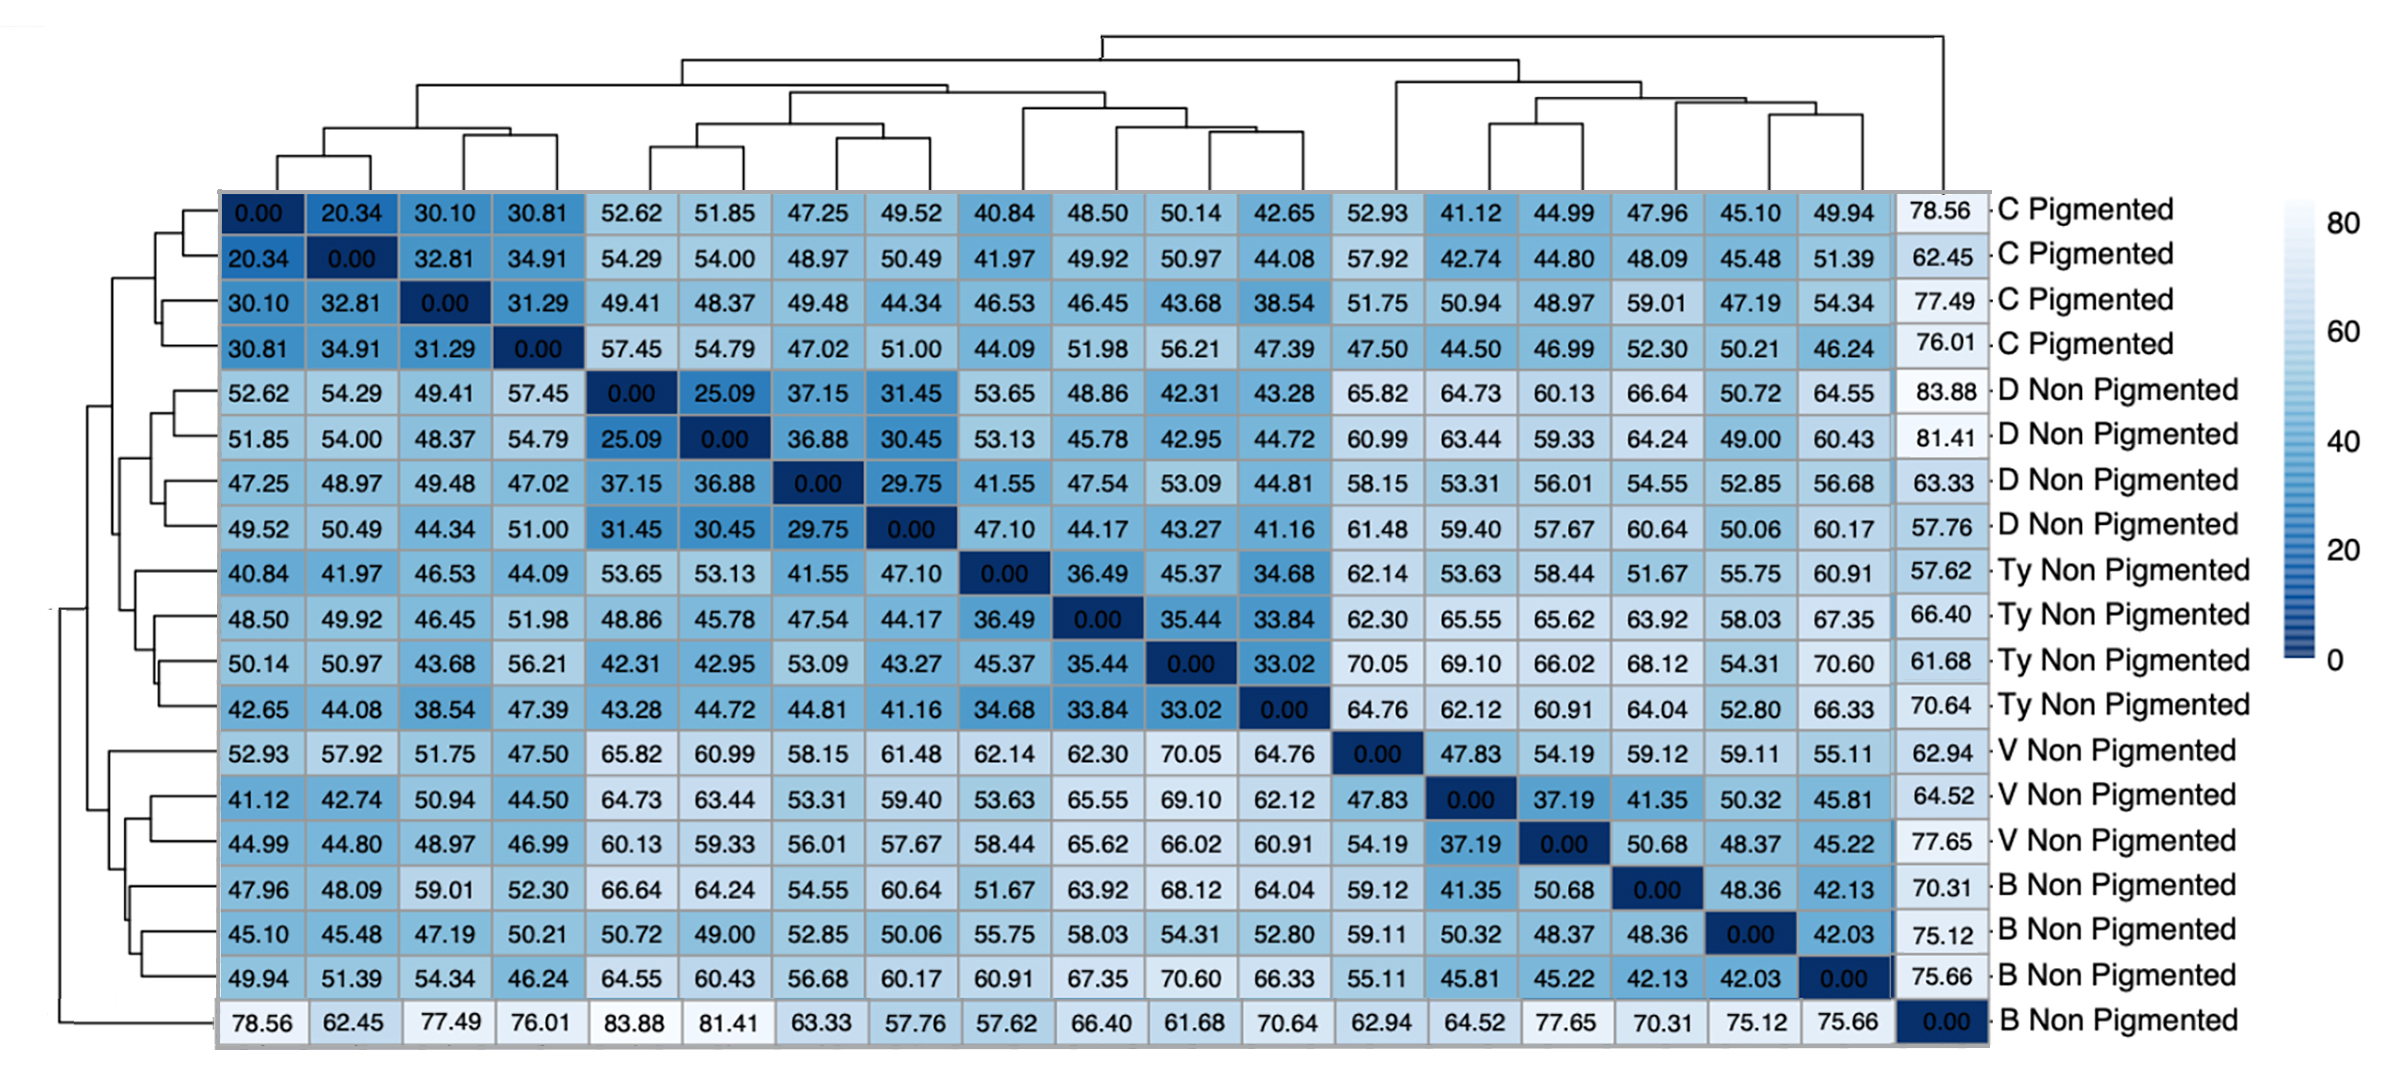
Figure 4.
Comparison heatmap. Heatmap of EOM from
C57BL/6
versus all albino tissues.
C57BL/6
is
C
;
BALB/c
is
B
;
CD-1
is V,
B6(Cg)-Tyr
c-2J
/J
is Ty, and the hypopigmented
DBA/1J mouse
is
D
.
 Figure 4 of
Johnson, Mol Vis 2026; 32:472-485.