Figure 3 of
Johnson, Mol Vis 2026; 32:472-485.
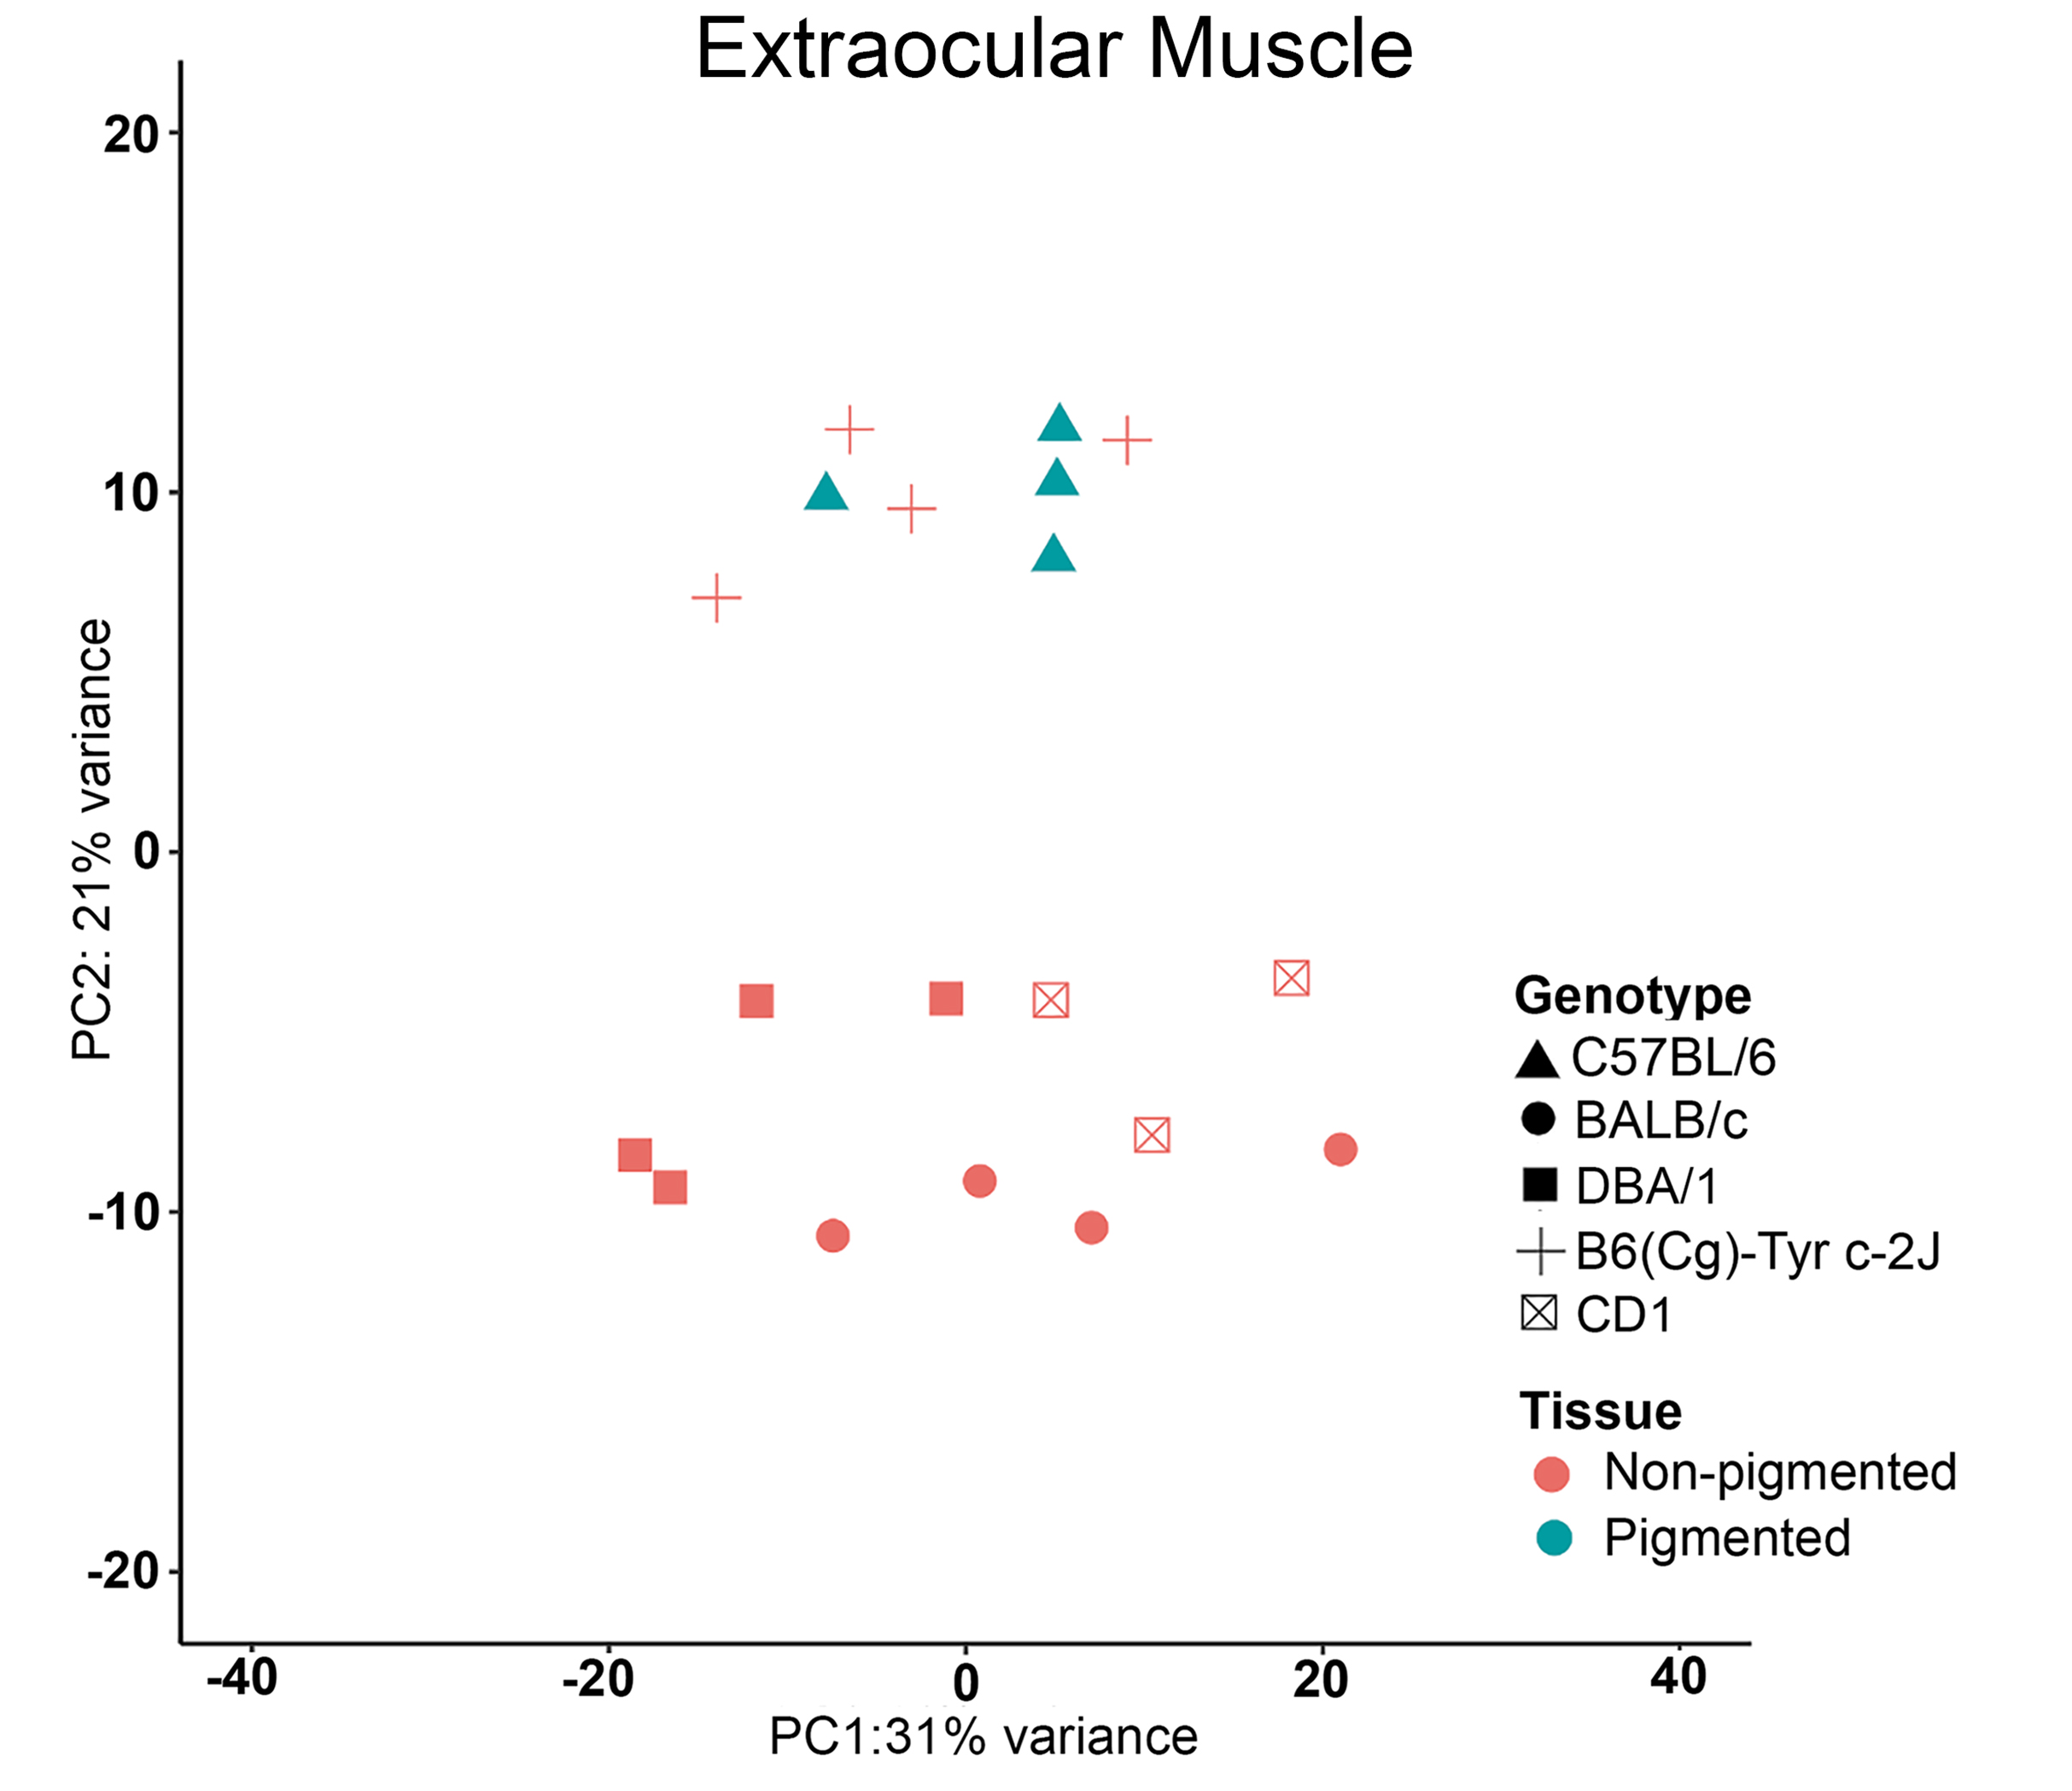
Figure 3.
Principal component analysis. Principal component analysis for EOM tissues created using a DESeq2 package in R to define the first two principal components comparing samples from the RNA-seq sequences generated.
 Figure 3 of
Johnson, Mol Vis 2026; 32:472-485.