Figure 1. CRX distribution in native retinas of wild-type, Pnpla2−/−, and Serpinf1−/− mice. A: Experimental plan. B: Confocal microscopy images of representative regions of interest (ROIs) showing immunostaining of CRX in whole-mount retinas
of Serpinf1+/+ and Serpinf1−/− mice at 3 months of age. C: Confocal microscopy images of representative ROIs illustrating CRX expression in whole-mount retinas from Pnpla2+/+ and Pnpla2−/− mice at 3 months of age. Each image is representative of three biological replicates (mouse eye) and four technical replicates
(ROIs per eye). D: CRX mean fluorescence intensity (MFI) was measured within each ROI and normalized to the number of DAPI-positive nuclei;
each point represents one explant from one of three independent mice (n = 3). Data are shown as mean ± SD. Statistical significance
was determined by ordinary one-way analysis of variance multiple comparisons: **p < 0.01.
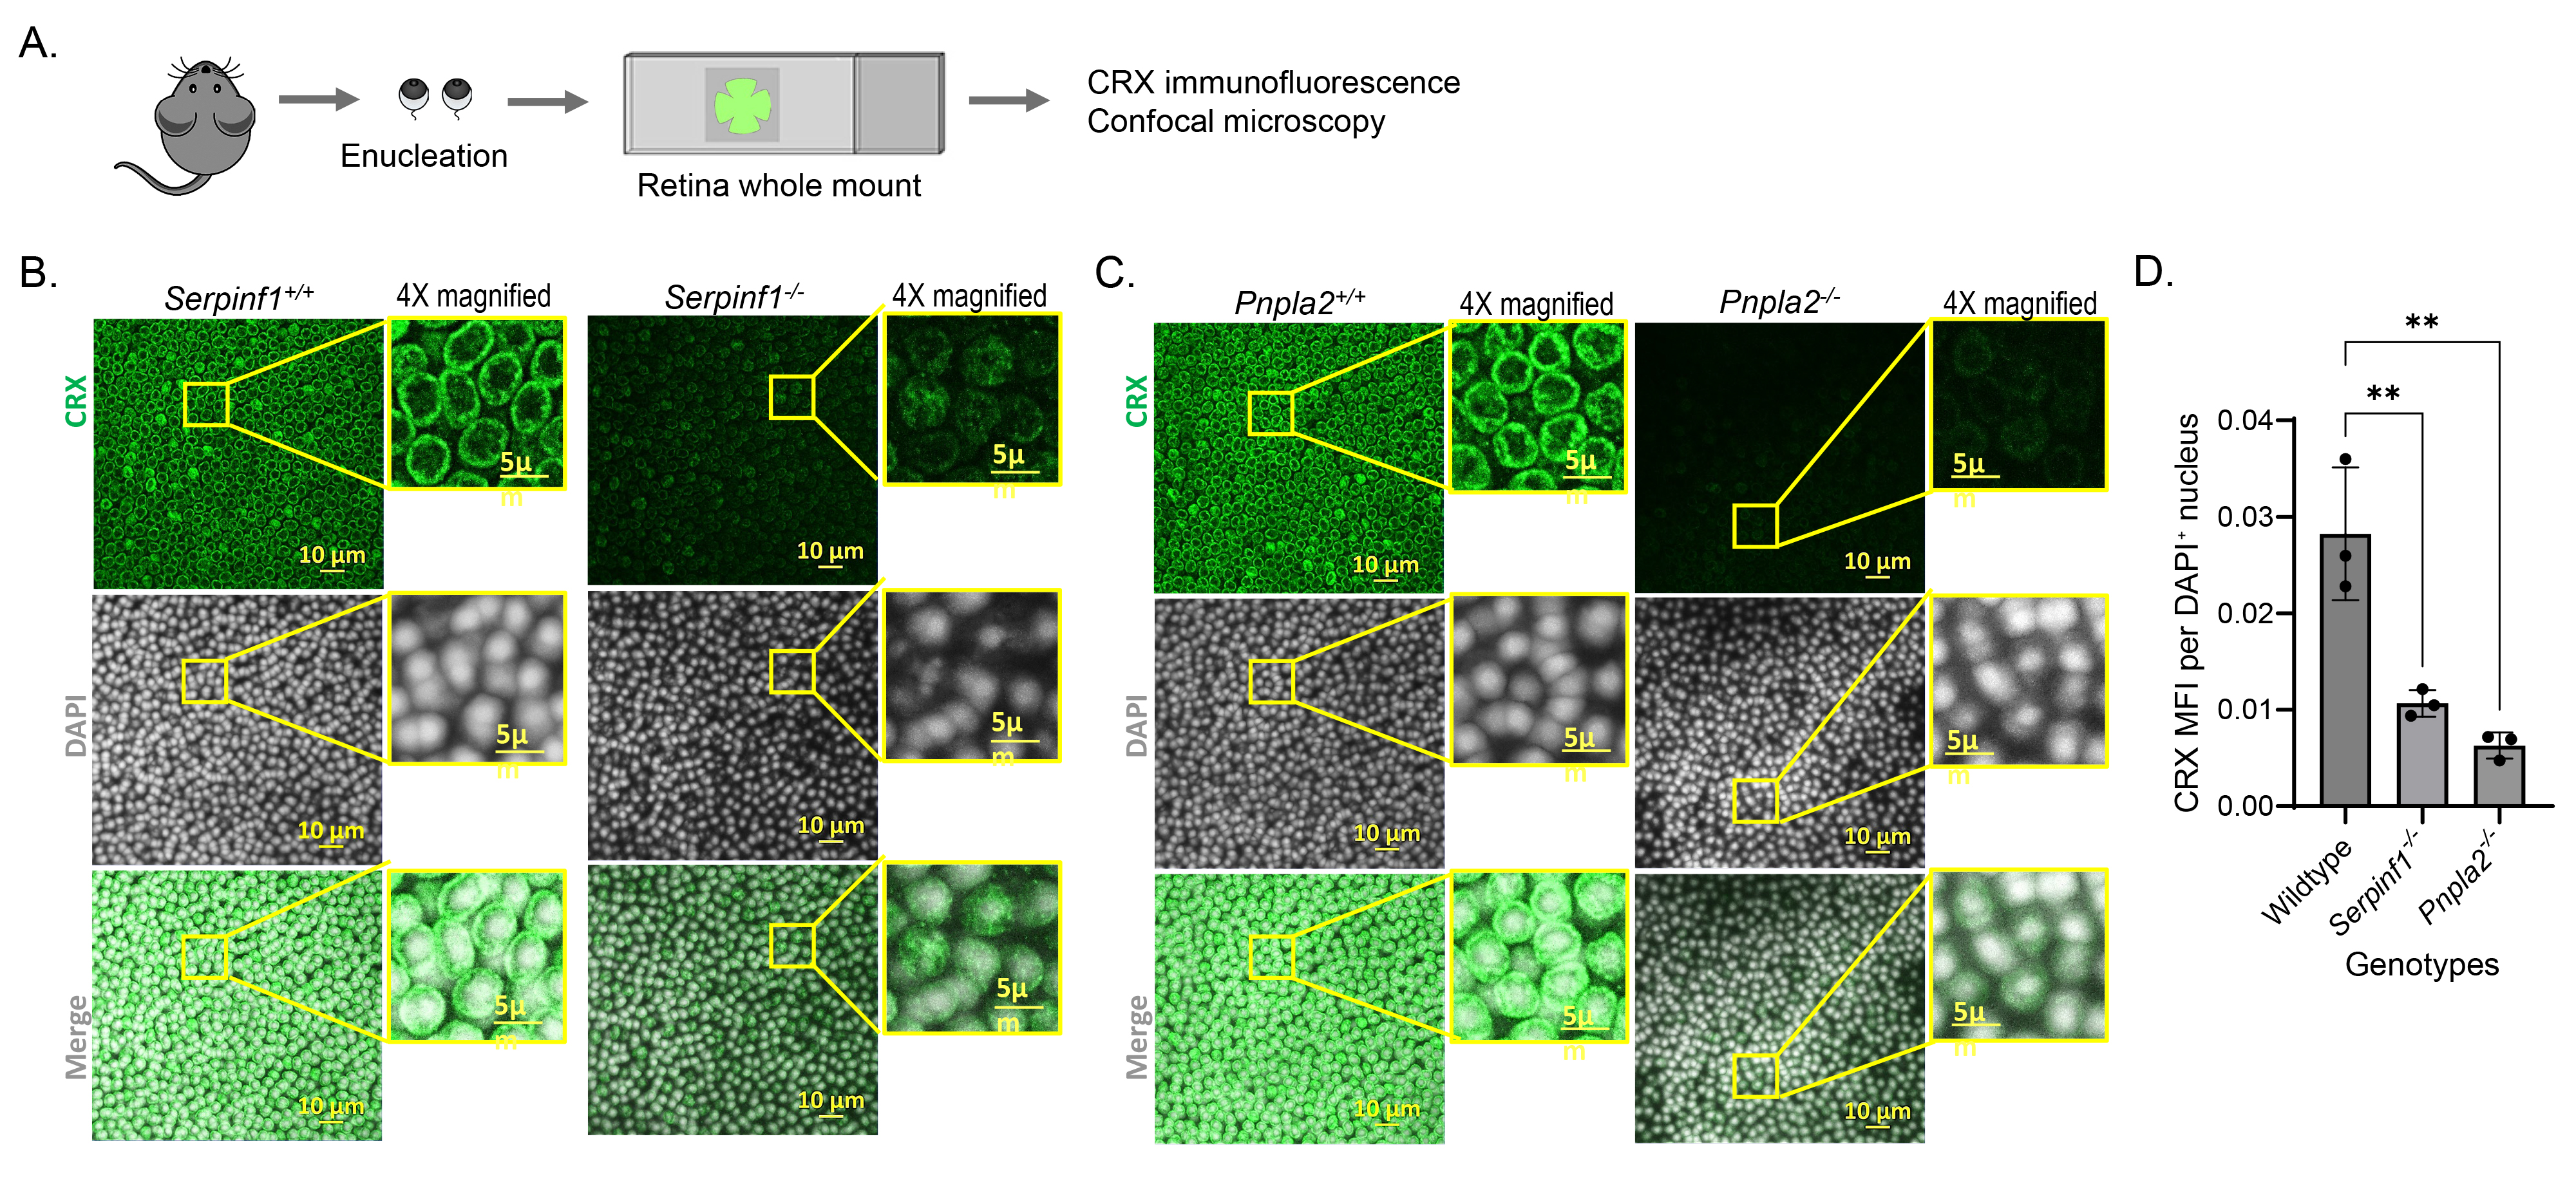
 Figure 1 of
Dixit, Mol Vis 2026; 32:435-449.