Figure 3. AQP5 deficiency triggers ferroptosis in SRA01/04 cells via the dysregulation of the Nrf2/SLC7A11/GPX4 signaling pathway. A: BODIPY581/591 C11 C11 fluorescence assay was performed to detect lipid reactive oxygen species levels in shNC and shAQP5 groups, and the
green-to-red fluorescence ratios were quantitatively analyzed using ImageJ software (n = 6). B: FerroOrange and Mito-FerroGreen fluorescence staining was conducted to evaluate intracellular and mitochondrial ferrous
ion levels, and the corresponding fluorescence intensities were measured and analyzed using ImageJ software (n = 6). C: Western blot assay was used to detect the protein expression level of Nrf2, and the relative protein expression levels were
quantitatively analyzed. D: Immunofluorescence labeling was performed to observe Nrf2 protein expression, and the fluorescence
intensities were quantified using ImageJ software (n = 6). (E) Western blot analysis was carried out to examine the protein
levels of SLC7A11, SLC3A2, and GPX4, and the relative expression levels of these proteins were quantified. F: Immunofluorescence
assays were performed to detect the expression of SLC7A11 and GPX4, and the corresponding fluorescence intensities were quantified
using ImageJ software (n = 6). All quantitative data are presented as the mean ± SD.
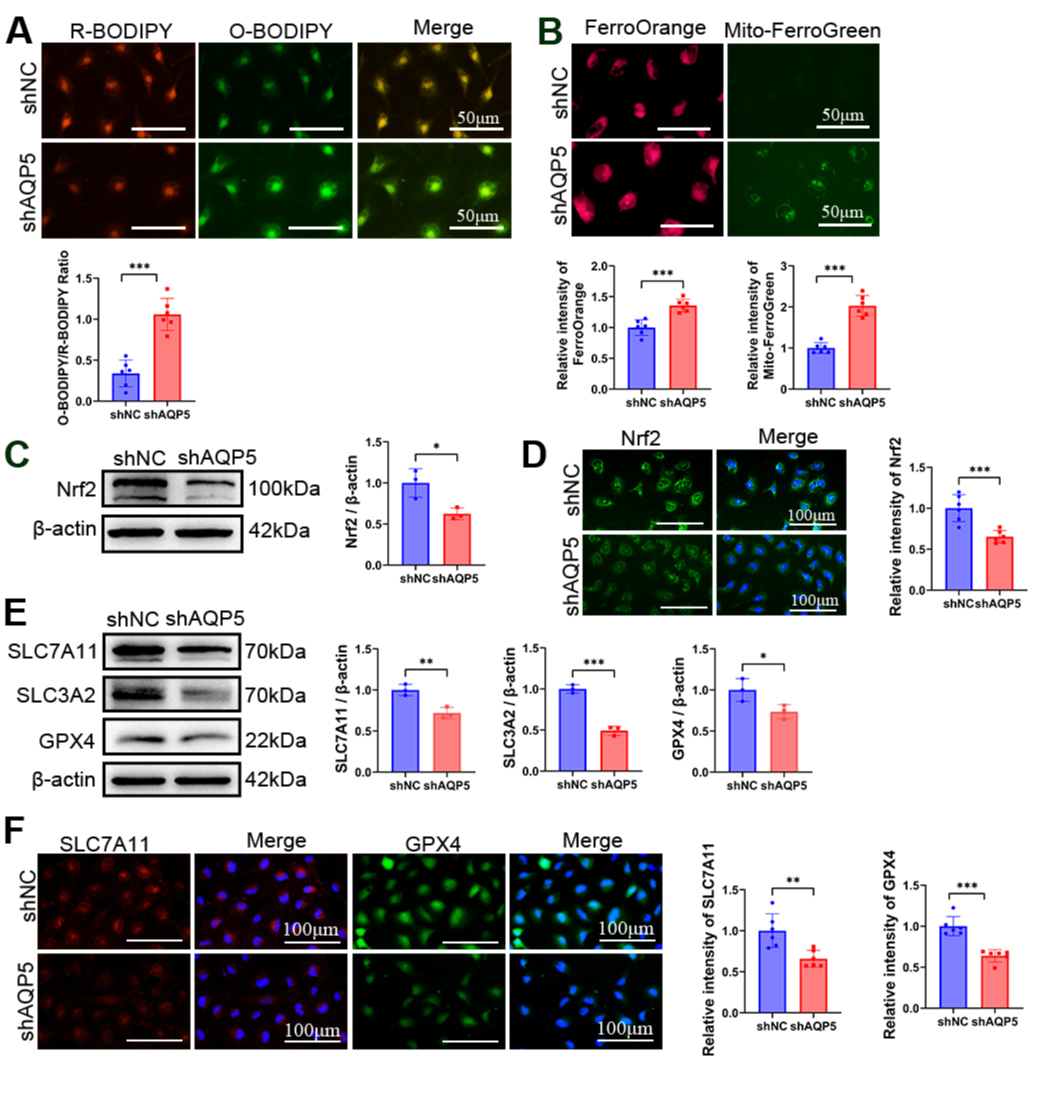
 Figure 3 of
Song, Mol Vis 2026; 32:354-369.