Figure 2. Interference with AQP5 expression induces mitochondrial dysfunction in SRA01/04 cells. A: Immunofluorescence staining was performed to detect AQP5 expression levels in Ctrl and AZ-treated SRA01/04 cells (n = 6).
B: MitoSOX fluorescent staining was utilized to evaluate mitochondrial reactive oxygen species levels in Ctrl and AZ-treated
cells (n = 6). C: The JC-1 fluorescent probe was used to assess the mitochondrial membrane potential in Ctrl and AZ-treated cells (n = 6).
D: The opening level of mPTP was detected in Ctrl andAZ-treated cells (n = 6). E: Western blot assay was performed to verify the knockdown efficiency of AQP5 short shRNA in SRA01/04 cells (n = 3). F-H: Fluorescence staining was carried out to detect mitochondrial reactive oxygen species, mitochondrial membrane potential,
and mPTP opening levels in the shNC and shAQP5 groups, respectively. The fluorescence intensities of all staining results
were quantitatively analyzed using ImageJ software (n = 6 for each group). All quantitative data are presented as the mean
± SD.
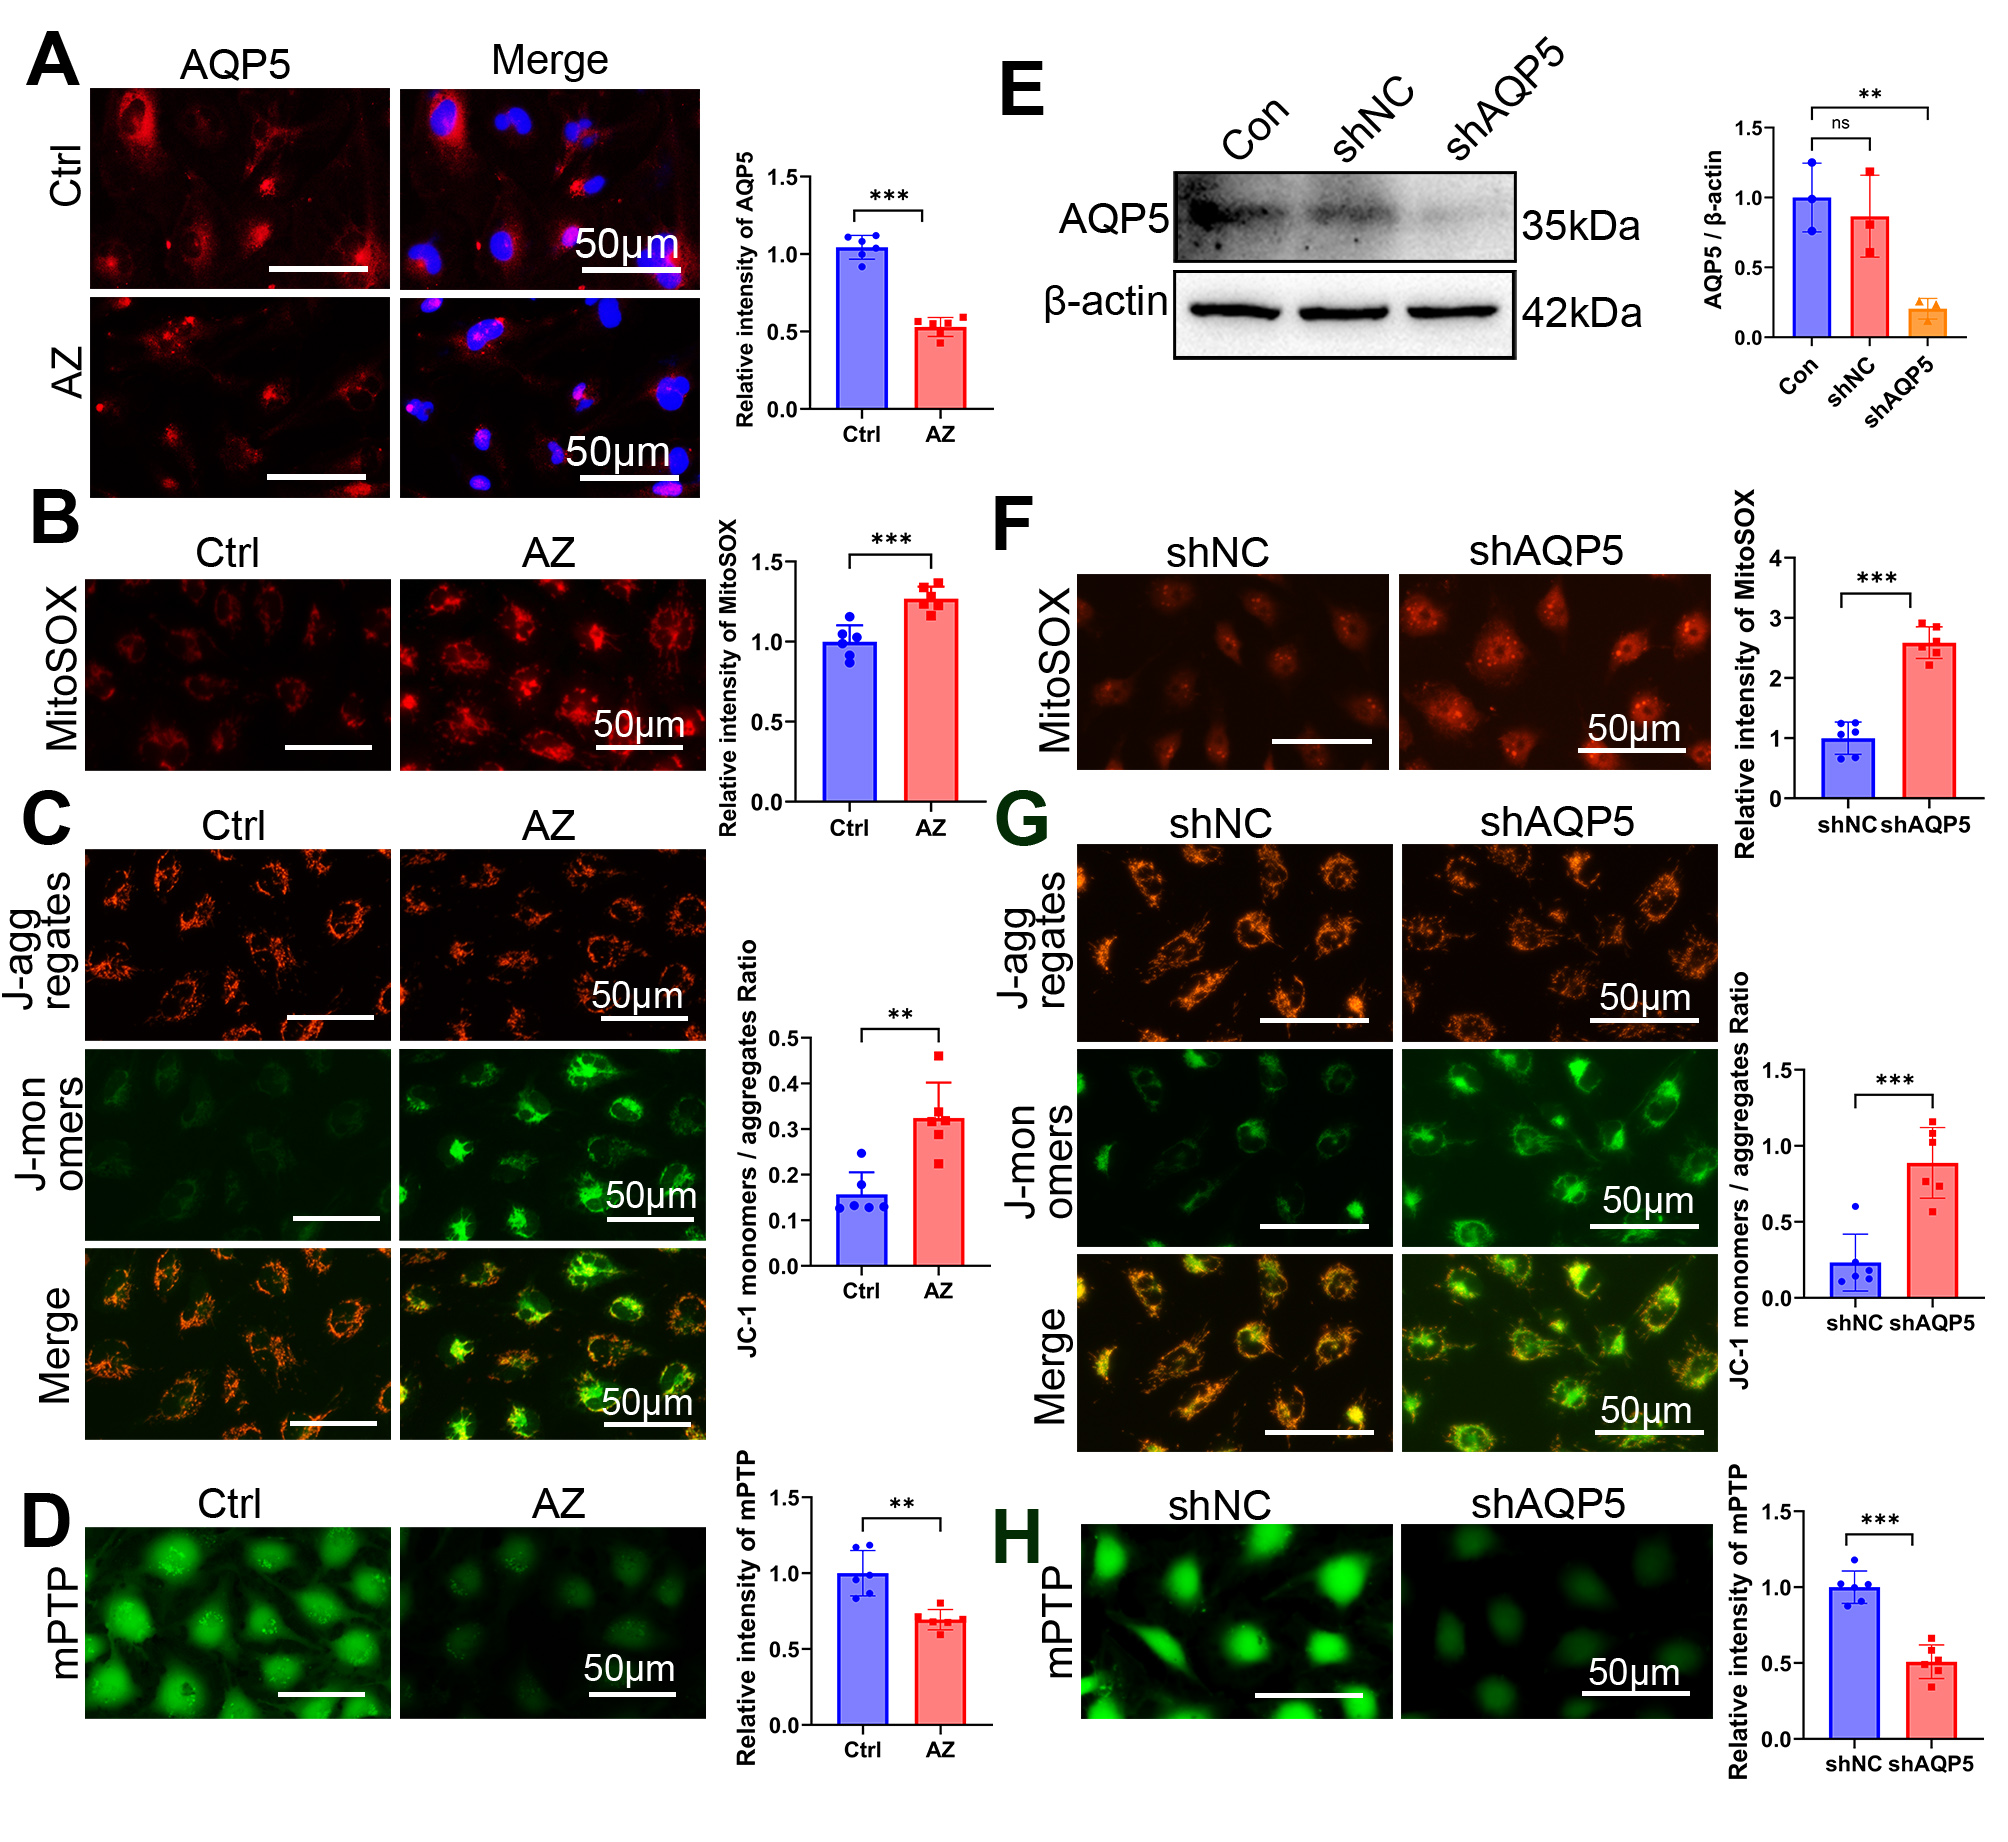
 Figure 2 of
Song, Mol Vis 2026; 32:354-369.