Figure 1. Characterization of human retinal pigment epithelial cells, pCAGGS-FLAG-VP24 expression plasmid, and transfection procedures.
A: Fluorescent photomicrographs of retinal pigment epithelial cells (isolate 4) immunophenotyped for five markers (cellular
retinaldehyde-binding protein [CRALBP], cytokeratin 8 [CK8], retinal pigment epithelium–specific 65 kDa protein [RPE65], zonula
occludens 1 [ZO], α–smooth muscle actin [α-SMA]) or species- and isotype-matched control antibodies (polyclonal rabbit IgG
[pR IgG], monoclonal rabbit IgG [mR IgG], monoclonal mouse IgG1k [mM IgG]), with 4′,6-diamidino-2-phenylindole (DAPI) nuclear
counterstain. Original magnification = 200×; scale bar = 100 μm. B: Schematic representation of the pCAGGS-FLAG-VP24 expression plasmid generated using PlasMapper version 3.0. C: Western blot of Zaire ebolavirus viral protein 24 (VP24) in protein extracted from ARPE-19 cells transfected with pCAGGS-FLAG-VP24 (arrowhead = expected molecular
weight, 29 kDa). Ladder (L) molecular weight standards are in kDa. D: Fluorescent photomicrograph showing a retinal pigment epithelial cell transfected with green fluorescent protein (GFP) expression
vector plus or minus rhodamine-labeled (Rho) polyinosinic-polycytidylic acid (poly I:C). Original magnification = 400×; scale
bar = 50 μm. E: Interferon-β (IFN-β) concentration measured in culture supernatant after cellular transfection with VP24 or no-insert control
(NI) expression plasmid for 48 h, followed by poly I:C for an additional 4 or 24 h by enzyme-linked immunosorbent assay. An
additional control replacing poly I:C with water was included for the 4-h condition. Circles represent mean protein concentration
for individual cell isolates, crossbars indicate mean, and error bars indicate standard deviation (n = 4 isolates/condition).
ND, ≥ 2 of 4 isolates below detection limit (7.8 pg/ml); ns, not significant.
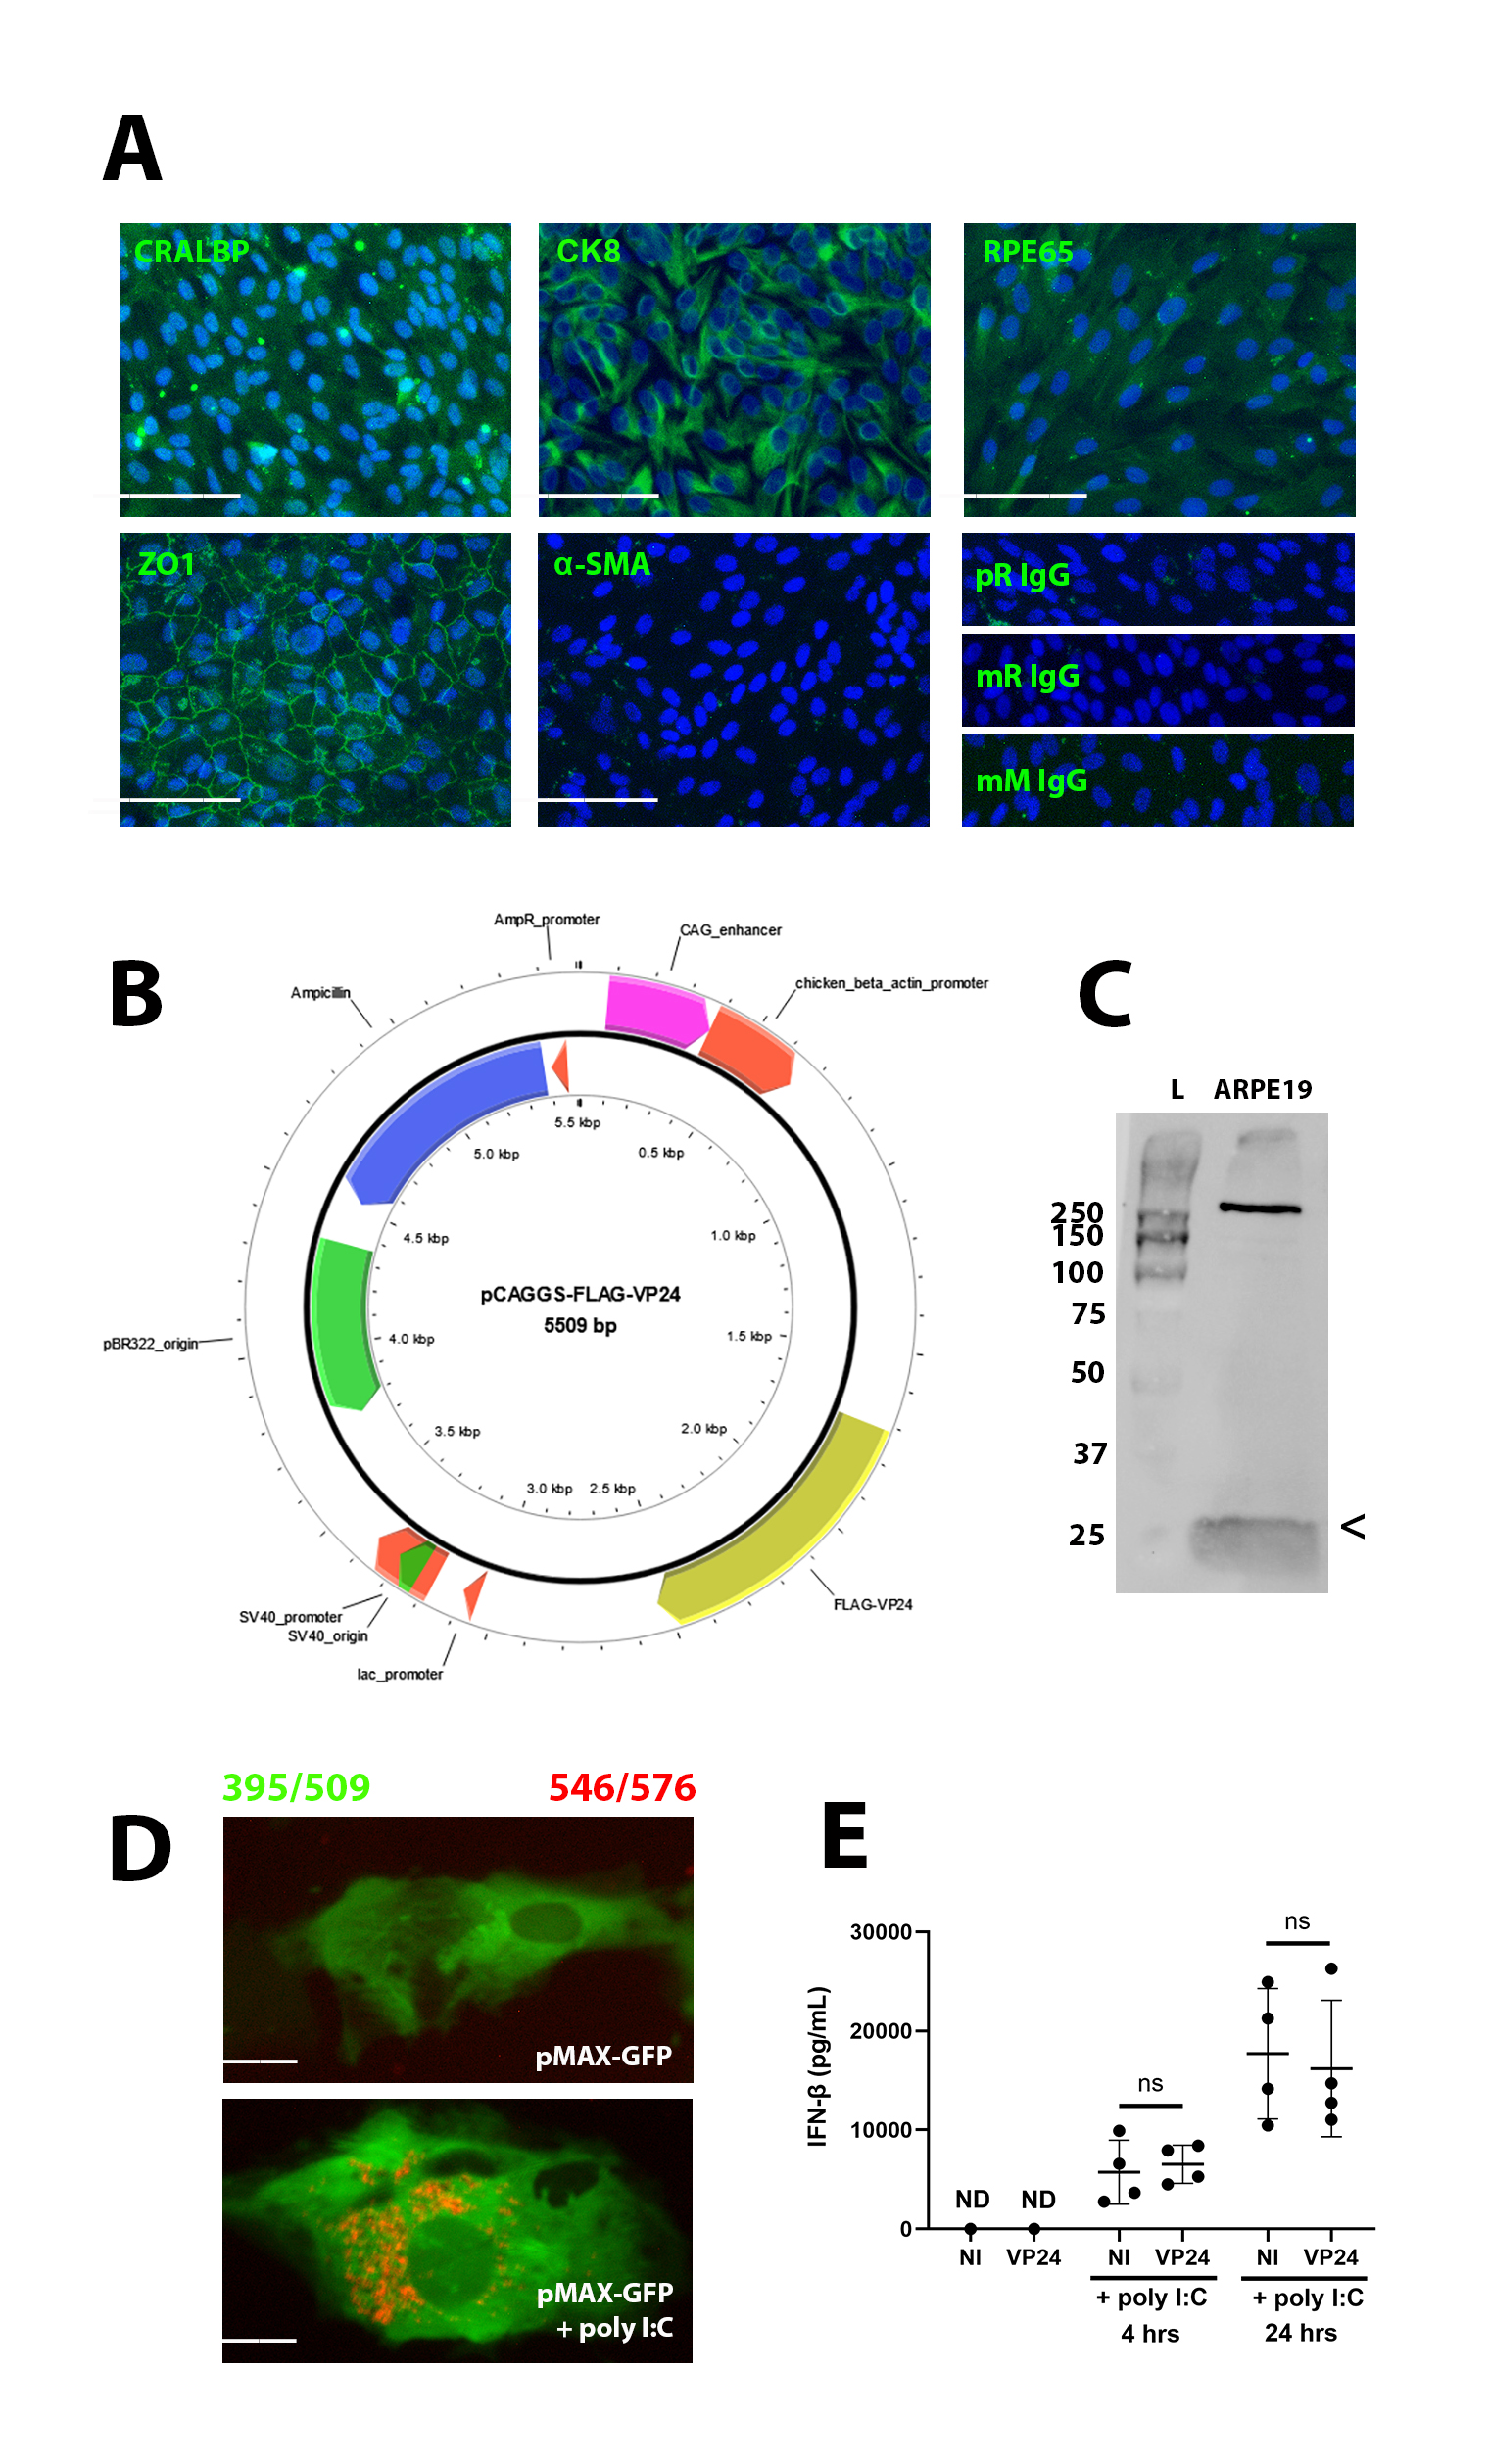
 Figure 1 of
Ashander, Mol Vis 2026; 32:34-48.
Figure 1 of
Ashander, Mol Vis 2026; 32:34-48.