Figure 1. Tasquinimod reduces retinal nonperfusion areas and preserves retinal architecture in oxygen-induced retinopathy (OIR) mice.
A: A schematic representation of the OIR model and experimental design is shown. The upper panel shows the normal group, and
the lower panel illustrates the OIR group exposed to 75% oxygen from postnatal day (P) 7 to P12, followed by normoxia until
P17. Tasquinimod (10 mg/kg/d) or phosphate-buffered saline (PBS) was administered by oral gavage from P12 to P17. B: Representative isolectin B4-stained whole-mount retinal images of the retinal vasculature are shown. The white-outlined
regions indicate avascular areas. The scale bar represents 200 μm. C: The avascular area as a percentage of the total retinal area was quantified. Data are presented as the mean ± SD (n = 6
per group). A p value of less than 0.05 was considered statistically significant. ***p < 0.001. D: Representative hematoxylin and eosin-stained retinal cross-sections at P17 are shown for each group. The OIR17 group shows
inner-retina disorganization with blurred GCL, IPL, and INL boundaries and focal preretinal cellular clusters. The OIR12 +
PBS 5d group exhibits persistent lamination irregularities with indistinct INL–IPL demarcation and local unevenness of the
inner retina. In contrast, the OIR12 + Tas 5d group displays more continuous lamination and fewer preretinal cellular clusters.
GCL indicates ganglion cell layer; INL indicates inner nuclear layer; and ONL indicates outer nuclear layer. The scale bar
represents 50 μm.
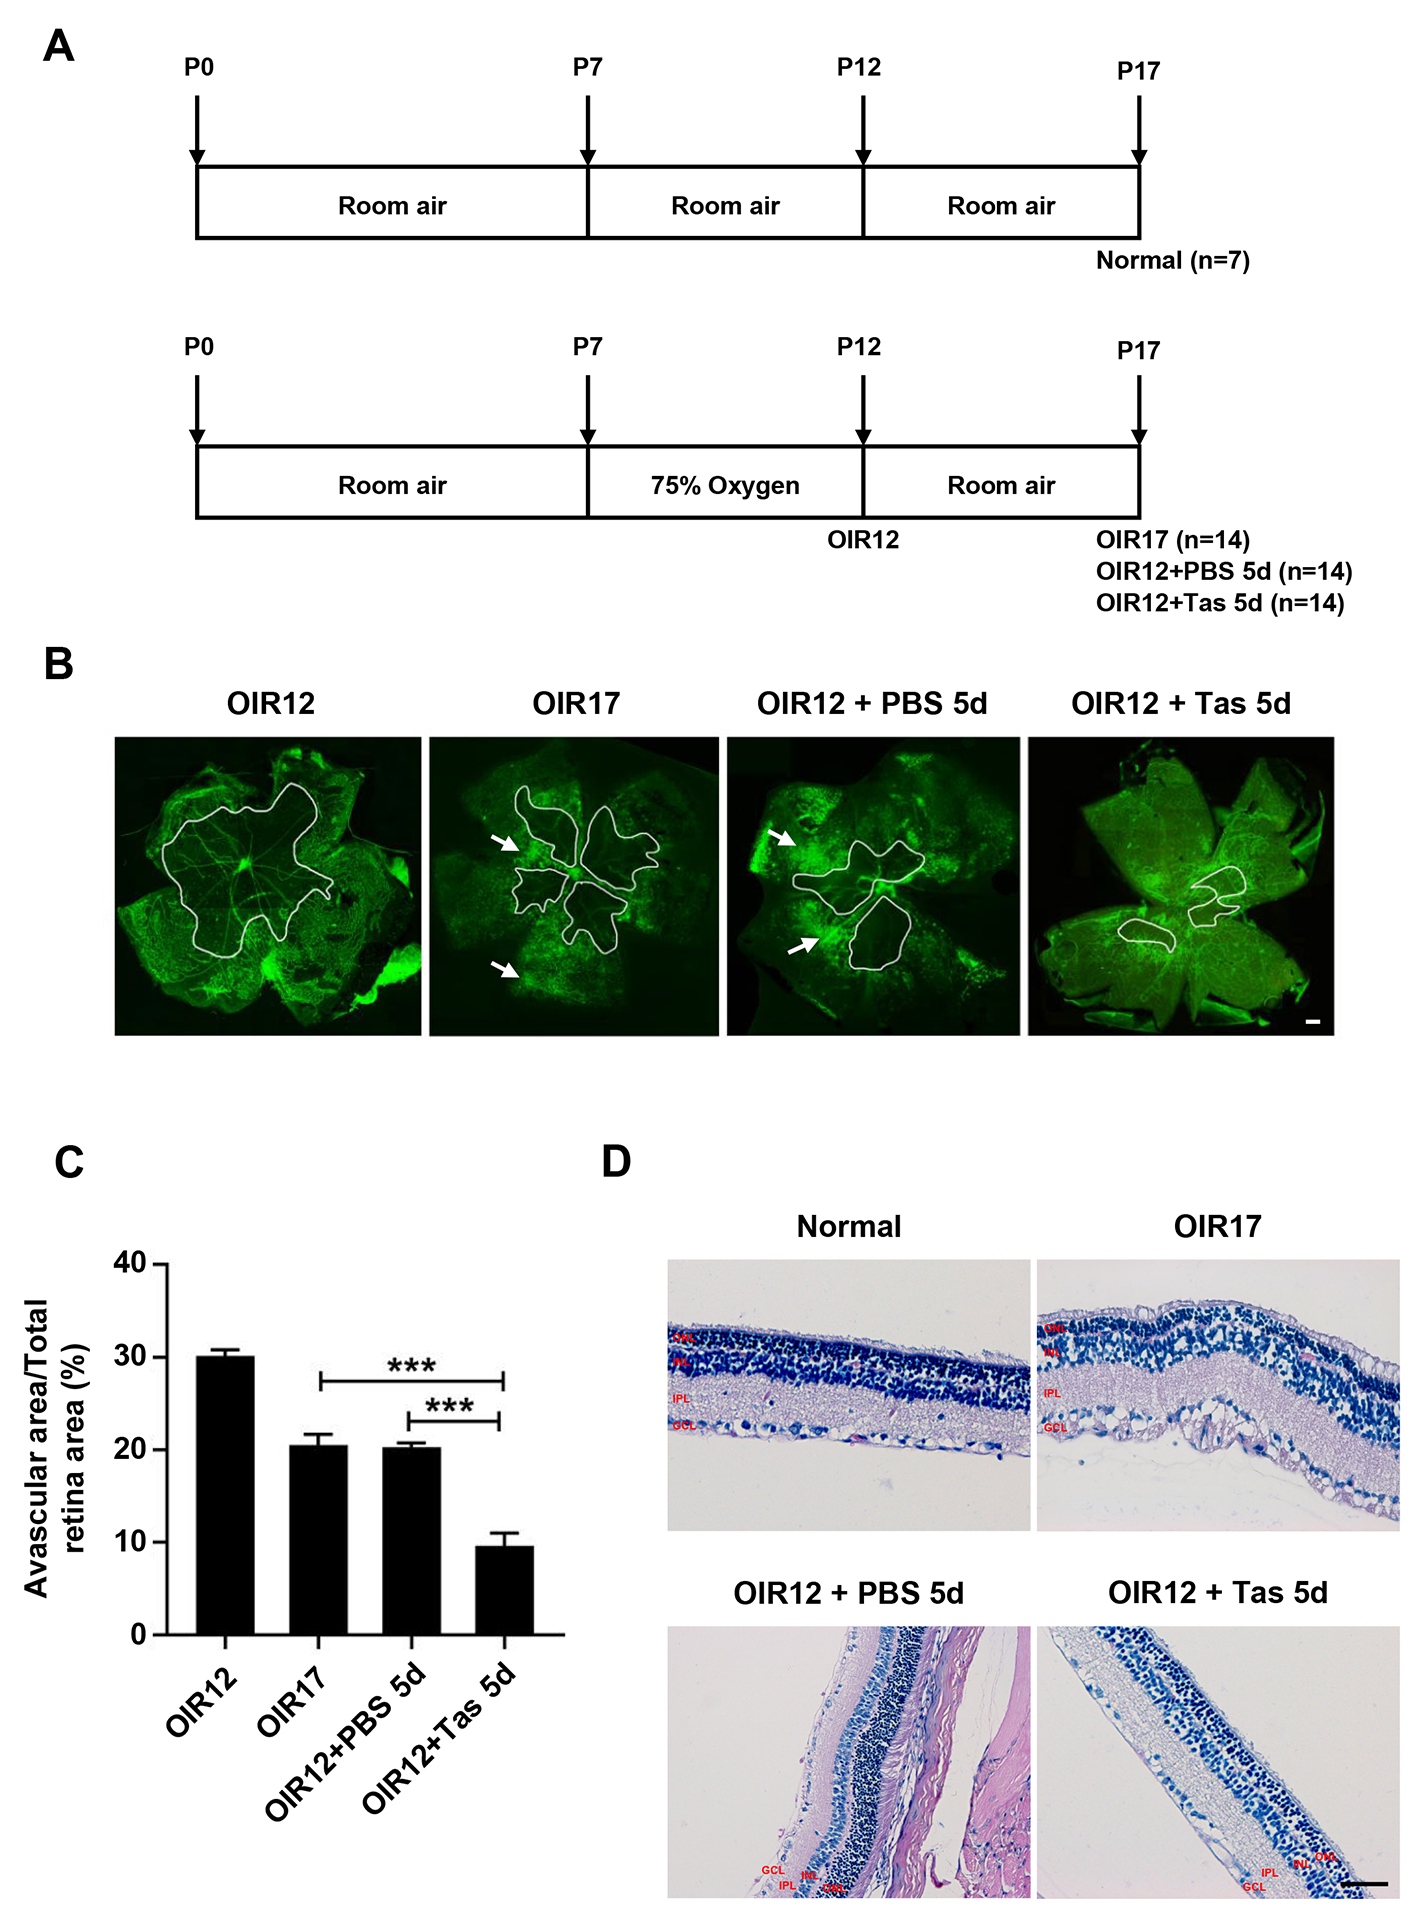
 Figure 1 of
Ji, Mol Vis 2026; 32:325-341.