Figure 9. Ultrastructural analysis of RPE cells reveals abnormalities in Bicdl1 KI mice. A, B: Representative EM images of RPE cells from 9-month-old Bicdl1 KI (n = 4) and WT (n = 3) mice. C: Standardized and masked analysis demonstrates a decrease in the average thicknesses of RPE cells, basal infoldings, and
the “bottom of BM to top of RPE” measurement. Ten to 13 EM fields were imaged per eye using a standardized and masked technique
in which the whole sample was scanned, and three EM fields were skipped between each photographed EM field. D: Quantification of the average basal and apical mitochondria number in RPE cells in Bicdl1 WT and KI mice are also presented as per EM field. Bicdl1 KI mice have a decreased number of mitochondria in both the basal and apical regions of RPE cells. E, F: The same samples were also analyzed per mouse. There was still a trend towards decreased basal infoldings and RPE thickness,
but this did not reach significance (E). Significance persisted for decreased basal and total mitochondria in KI mice (F). Green line: RPE cell body thickness (excluding the microvilli), yellow line: basal infoldings, black squares: WT mice,
blue squares: Bicdl1 KI mice, Data are shown as means ± SEM. ns: non-significant, *: p < 0.05, **: p < 0.01, ****: p < 0.0001. Scale bar: 2 µm.
Images were captured at 2500x nominal magnification.
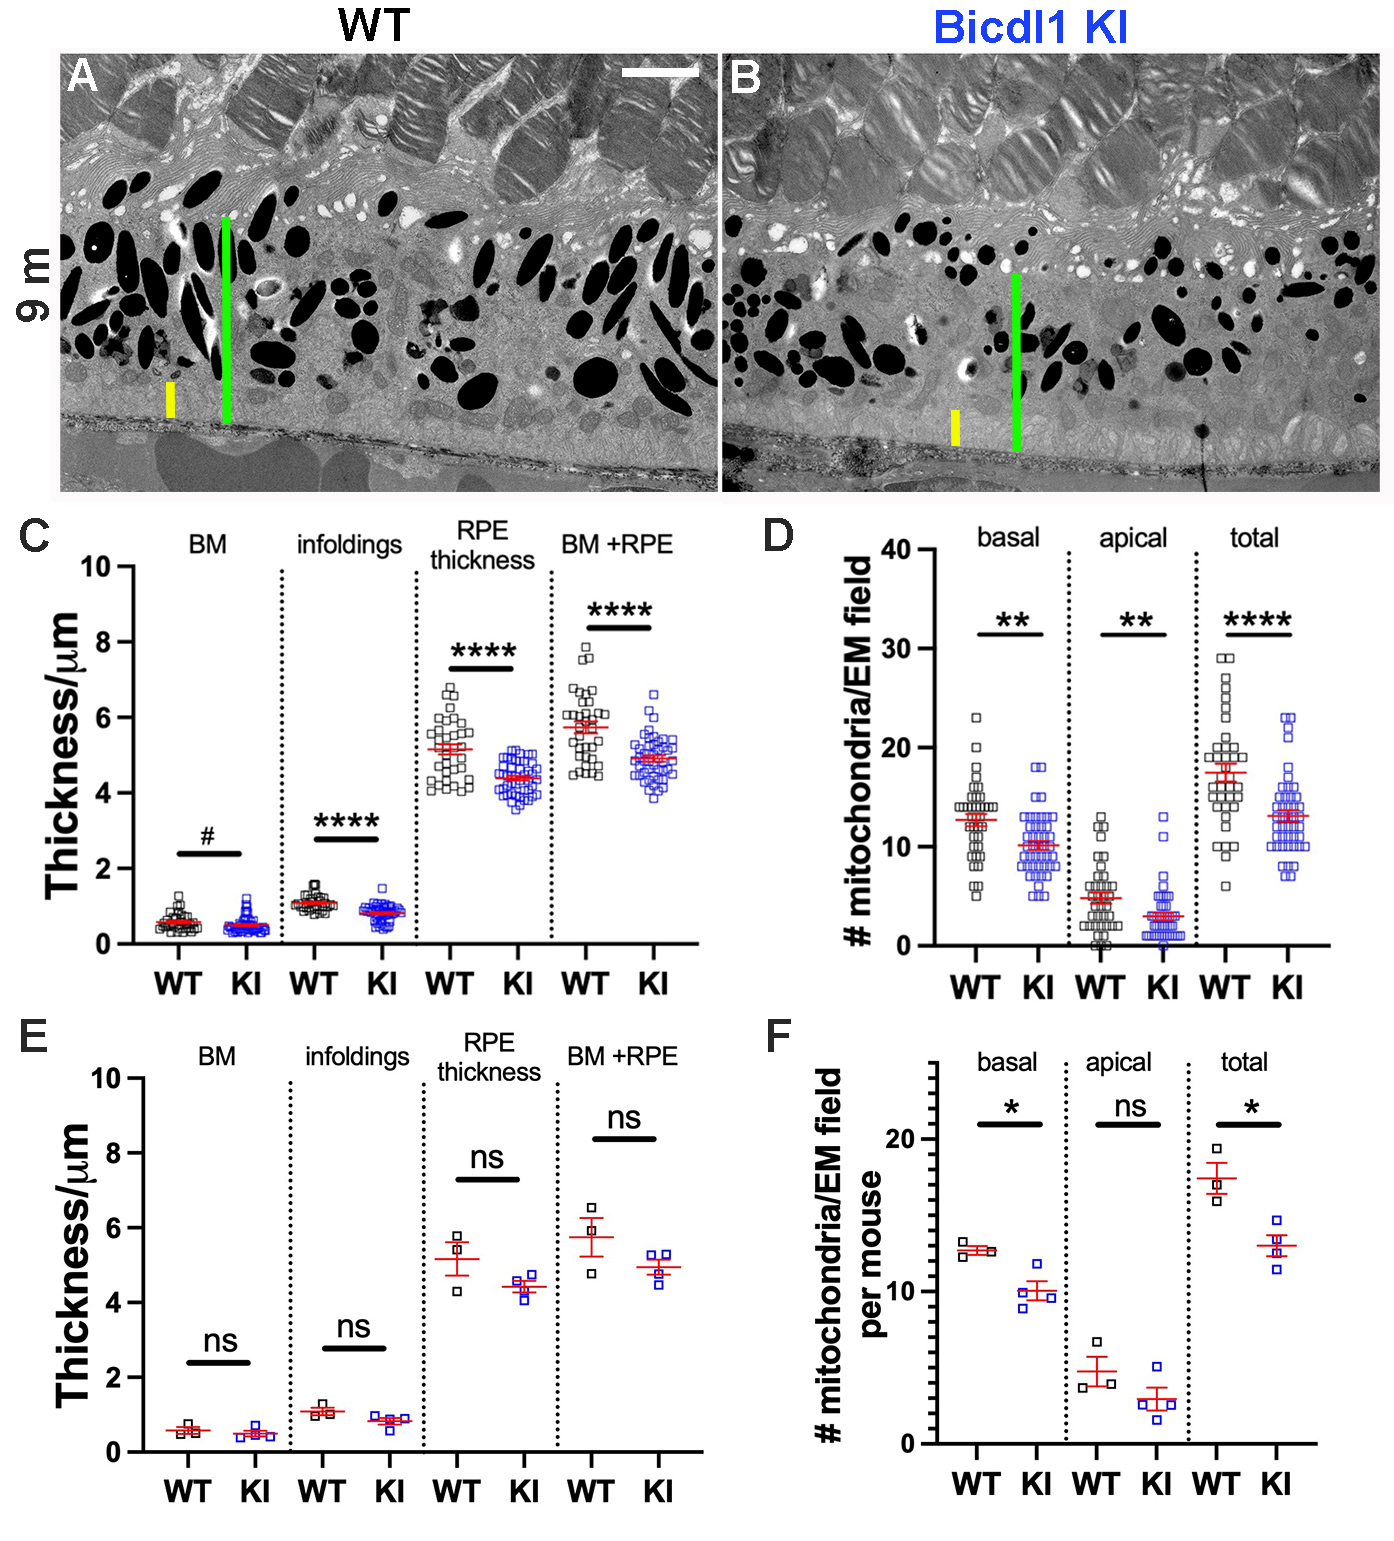
 Figure 9 of
Ulker-Yilmazer, Mol Vis 2026; 32:281-306.
Figure 9 of
Ulker-Yilmazer, Mol Vis 2026; 32:281-306.